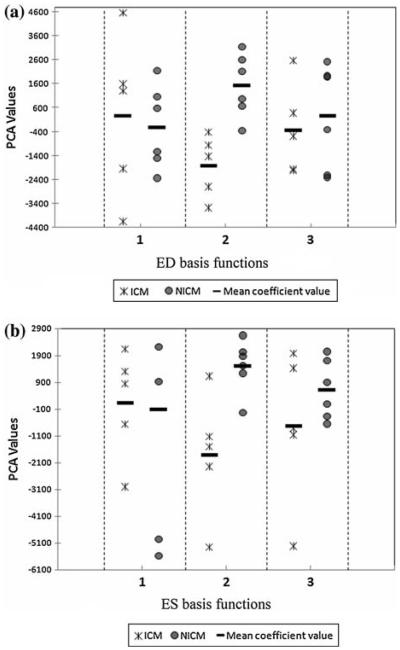
FIGURE 4.
PC analysis of training set initial momenta (a) The scatter plot of coefficients (ICM [star] and NICM [circle]) associated with heart images acquired at ED using the first 3 PCA basis functions (eigenvectors). (b) The scatter plot of coefficients (ICM [star] and NICM [circle]) associated with heart images acquired at ES using the first 3 PCA basis functions (eigenvectors). Each data point represents PC value calculated for one subject. Note that for both cases, the coefficients for the second PC show minimum overlap, and hence can be used to discriminate groups.

