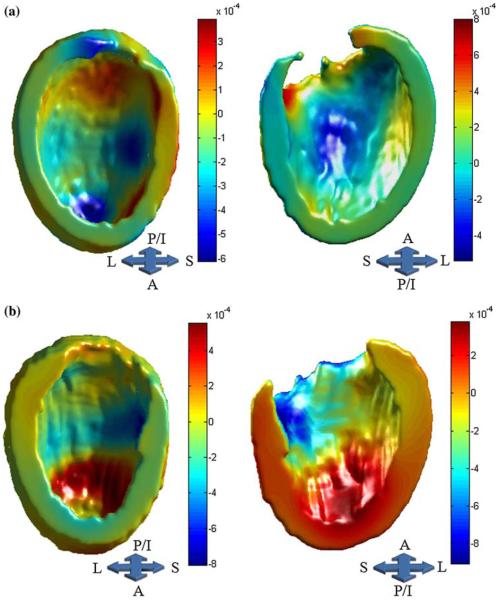
FIGURE 5.
Surface-normal component map for ED (a) and ES (b) superimposed on the template surface. This map demonstrates the magnitude of outward (warmer colors) and inward movements (cooler colors), as defined by initial velocity vector fields in the direction of the second largest variation subspace. The magnitude and sign of the PC coefficients computed for each group determines the direction of deformations across groups (e.g., negative coefficients reverse the direction of deformation).

