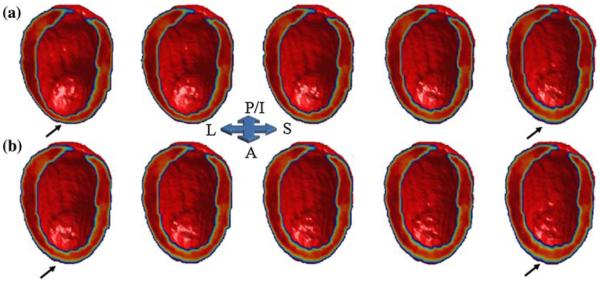
FIGURE 6.
Reconstructed LV images at ES for ICM (a) and NICM (b) subjects using the second highest geometric variance direction (second PC). The middle column in each row represents the reconstructed image using group mean coefficient for the second PC. The first and second columns (from left) in each row represents images synthesized at −2 and −1 σ of 2nd PC mean coefficient, and the fourth and fifth columns (from left) in each row represents images synthesized at +1 and +2 σ of the 2nd PC mean coefficient, respectively. Subjects in the ICM group, in comparison to the NICM group, exhibit larger within group variation of anterior wall shape (arrows).

