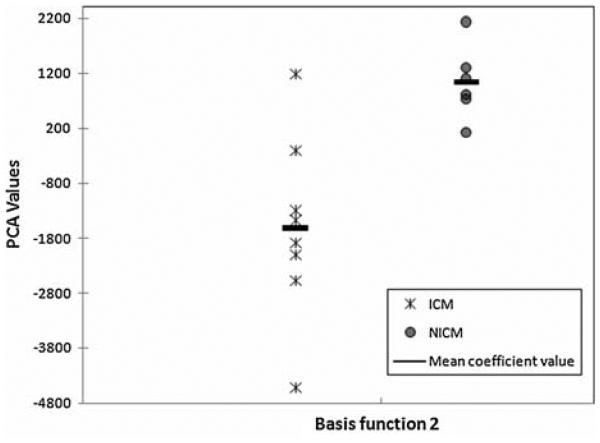
FIGURE 7.
PC analysis of test set initial momenta. The scatter plot of coefficients associated with test set heart images acquired at ES using the second PC basis function (eigenvectors) derived from the training set. Each data point represents PC value calculated for one subject. The coefficients show good separation (Wilcoxon rank sum p value 5 = 0.008).

