
Fig. 1.
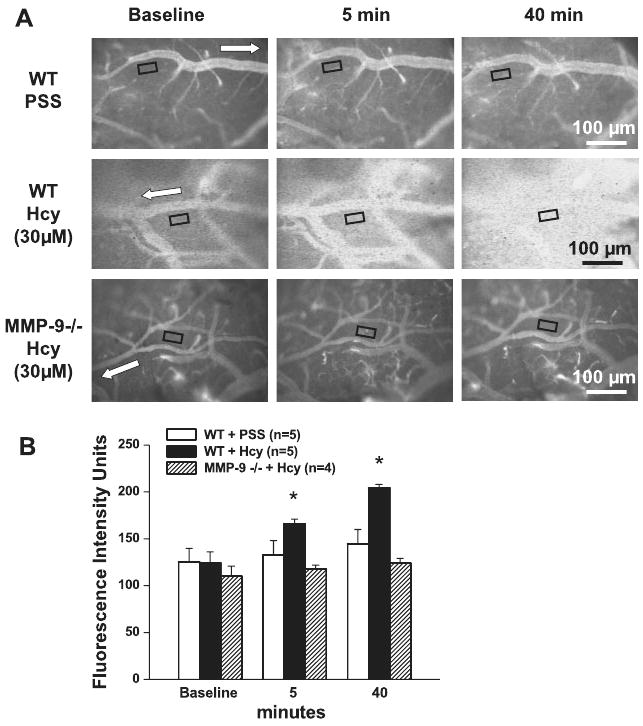
Homocysteine (Hcy)-induced macromolecular leakage of pial venules. A: examples of images recorded before (baseline) and 5 and 40 min after injection of either PSS (top row) or Hcy (final blood concentration 30 μM) in wild-type (WT; top rows) and matrix metalloproteinase (MMP)-9 gene knockout mice (bottom row). Microvascular leakage was assessed by measuring fluorescence intensity in the rectangular area of interest (AOI) shown on images. White arrows indicate flow direction in veins. B: summary of changes in fluorescence intensity after injection of PSS or Hcy measured in the AOI. Values are means ± SE. *P < 0.05 vs. control at the same time.