
Fig. 4.
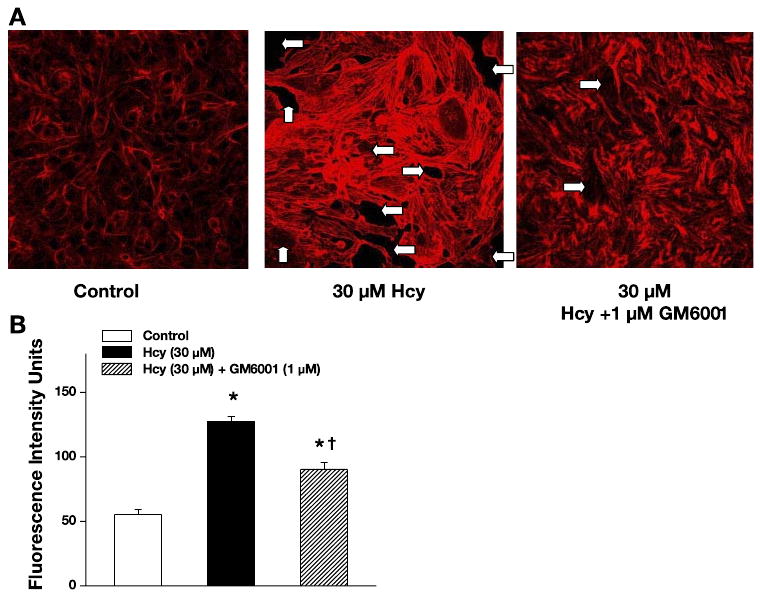
Hcy-induced formation of F-actin in mouse endothelial cells. A: examples of images recorded after treatment with PSS (control), 30 μM Hcy, or 30 μM Hcy in the presence of MMP blocker GM-6001 (1 μM). White arrows indicate gap formation in the initially confluent endothelial cell monolayer. B: increase in formation of F-actin after Hcy treatment and its inhibition by GM-6001. Values are means ± SE. *P < 0.05 vs. control; †P < 0.05 vs. Hcy treated. n = 4 for all groups.