The potent redox activity of copper is essential yet toxic to living organisms.1-4 Accordingly, cells tightly regulate copper to harness this capacity for beneficial purposes, as disruption of copper homeostasis is linked to oxidative or nitrosative stress through the aberrant production and/or consumption of reactive oxygen and nitrogen species (ROS/RNS), respectively.3,5-7 Because spatial and temporal fluxes in cellular copper pools can have disparate physiological or pathological consequences, new methods for monitoring copper in living cells can help elucidate its complex contributions to healthy and disease states.8-10 Molecular imaging with copper-responsive indicators provides an attractive approach to achieving this goal, and synthetic sensors11,12 and dosimeters13 that give a turn-on emission increase to Cu+ or Cu2+ in water have been reported recently.14
Despite these advances, fluorescent copper indicators that have been used successfully in biological experiments are rare,11,12,15-18 as creating molecules that possess an appropriate combination of chemical selectivity, optical sensitivity, and biological compatibility remains a challenging task. In addition, although intensity-based reagents are of practical utility, external influences that lead to variations in probe concentration and environment can complicate measurements in biological samples. These potential artifacts can be minimized by ratiometric imaging, which relies on probes that have two distinct measurable signals in the presence or absence of analyte.19 Here, we present Ratio-Coppersensor-1 (RCS1), a new type of ratiometric fluorescent reporter for copper. RCS1 possesses high selectivity for Cu+ over competing metal ions at cellular concentrations and a ca. 20-fold fluorescence ratio change upon Cu+ binding. Confocal microscopy experiments establish the ability of RCS1 to report changes in Cu levels, including mobilization of endogenous Cu+ stores by ascorbate.
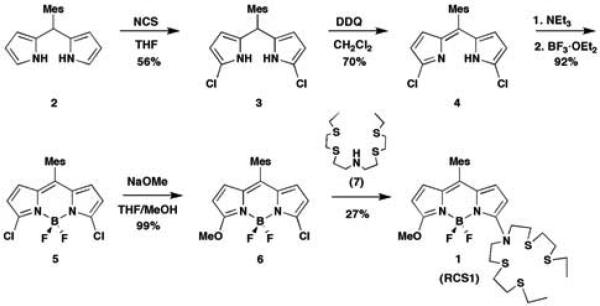
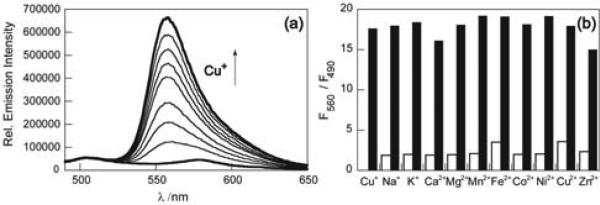
Our strategy for ratiometric sensing of cellular copper is based on modulating an asymmetric BODIPY fluorophore platform. A related fluorescent sensor for detecting K+ in mixed aqueous- acetonitrile media has been reported.20 RCS1 is synthesized in 5 steps as outlined in Scheme 1. In HEPES buffer at pH 7.0, RCS1 exhibits a major absorption peak centered at 550 nm (ε = 4.3 × 10⁴ M-1 cm-1) with a shoulder at 523 nm (ε = 2.6 × 10⁴ M-1 cm-1). Upon excitation at 480 nm, RCS1 displays two emission maxima of near equal intensity centered at 505 nm (Φ = 0.002) and 570 nm (Φ = 0.003). Addition of one equivalent of Cu+ induces a hypsochromic shift of the dominant absorption and emission bands to 548 nm (ε = 4.0 × 10⁴ M-1 cm-1) and 556 nm, respectively, with a concomitant 20-fold fluorescence increase (Φ = 0.05). Notably, the emission intensity at 505 nm is unchanged, rendering the compound useful for ratiometric applications. Binding analysis using the method of continuous variations suggests that a 1:1 RCS1:Cu+ complex is responsible for the ratiometric fluorescence response, and the apparent Kd for Cu+ complexation to RCS1 in HEPES buffer at pH 7.0 is 4.0(3) × 10-11 M (Supporting Information). Owing to its thioether-rich receptor, the ratiometric fluorescence response of RCS1 is selective for Cu+ over various biologically relevant metal ions (Figure 1b). The emission profiles of apo or Cu+-bound RCS1 are unchanged in the presence of 1 mM Na+, K+, Ca2+, or Mg2+, and first-row d-block metal ions, including 50 μM Mn2+, Fe2+, Co2+, Ni2+, Cu2+, and 1 mM Zn2+ do not interfere or give false positives within 10% of the full turn-on to Cu+. We next sought to assess whether RCS1 could report changes in the levels of labile Cu in living cells by ratiometric fluorescence imaging. Initial experiments in HEK 293T cells established that we could observe changes in fluorescence ratios in cells treated with exogenous Cu sources or Cu chelators (Figure S6). We then examined whether this indicator could visualize changes in endogenous pools of exchangeable intracellular copper. In this context, ascorbate has been reported to facilitate the ceruloplasmin-dependent uptake and distribution of Cu in K562 cells.21 We reasoned that application of this reductant would shift Cu2+/+ redox equilibrium and increase the kinetically labile Cu+ pool. Ratio images of live C6 rat glioma cells labeled with RCS1 reveal that ascorbate-treated samples possess an elevated level of labile Cu+ compared to untreated samples (Figures 2a, b). Control experiments with a cell-permeable Cu+ chelator, tris((ethylthio)ethyl)amine (TEMEA), confirms that the observed fluorescence ratio changes are due to Cu+ binding (Figure 2c). Furthermore, co-incubation of C6 cells with ascorbate and bathocuproine disulfonate (BCS), a cell-impermeable chelator, has no effect on ascorbate-induced increases in the labile Cu+ pool, showing that the transient increases in labile Cu+ detected by RCS1 originate from intracellular stores (Figures 2d, e). Analogous studies in HEK 293T cells show similar results (Figures S8-S11).
Scheme 1.
Synthesis of Ratio-Coppersensor-1 (RCS1)
Figure 1.
(a) Fluorescence response of 2 μM RCS1 to Cu+. Spectra shown are for [Cu+] of 0, 0.3, 0.5, 0.8, 1.0, 1.3, 1.5, 1.8, and 2.0 μM. Spectra were acquired in 20 mM HEPES, pH 7, with excitation at 480 nm. (b) Fluorescence responses of RCS1 to various metal ions. Bars represent the final integrated ratiometric fluorescence response from 525-650 nm (F560) over the initial integrated emission from 490-525 nm (F490). Initial spectra were acquired in 20 mM HEPES, pH 7. White bars represent the addition of an excess of the appropriate metal ion (1 mM for Na+, K+, Ca2+, Mg2+, and Zn2+, 50 μM for all other cations) to a 2 μM solution of RCS1. Black bars represent the subsequent addition of 2 μM Cu+ to the solution. Excitation was provided at 480 nm and the emission was integrated over 490-525 nm and 525-650 nm.
Figure 2.
(a) Confocal fluorescence ratio images of live C6 rat glioma cells grown in basal media and stained with 2 μM RCS1 for 10 min at 37 °C. (b) C6 cells treated with 1 mM ascorbate for 4 h and stained with 2 μM RCS1 for 10 min at 37 °C. (c) C6 cells from condition (b) treated with 1 mM TEMEA for 5 min by direct addition to the Petri dish on the microscope stage. (d) C6 cells incubated with 200 μM BCS for 4 h and stained with 2 μM RCS1 for 10 min at 37 °C. (e) C6 cells treated with 200 μM BCS and 1 mM ascorbate for 4 h, then stained with 2 μM RCS1 for 10 min at 37 °C. (f) Bar graph representing the integrated intensity from 564-639 nm over the integrated fluorescence intensity from 522-554 nm. Values are the mean ratio generated from the intensity from five randomly selected fields. Error bars represent standard error measurement (s.e.m.)
In closing, we have presented a new type of ratiometric Cu+-specific fluorescent sensor for molecular imaging in living systems. RCS1 features high selectivity for Cu+ over other metal ions and a ca. 20-fold fluorescence ratio change with visible excitation and emission profiles. Experiments with live cells show that RCS1 is capable of detecting changes in levels of intracellular Cu+ upon exogenous copper addition, as well as sensing ascorbate-stimulated expansions of endogenous Cu+ pools. We are applying RCS1 and developing improved versions for studying the intracellular redox biology of copper, with particular interest in brain and immune systems.
Supplementary Material
Acknowledgment
We thank the Packard and Sloan Foundations, the Hellman Faculty Fund (UC Berkeley), Amgen, and the NIH (GM 79465) for providing funding for this work. C.J.C. is an Investigator with the Howard Hughes Medical Institute. We thank Holly Aaron (UCB Molecular Imaging Center) and Ann Fischer (UCB Tissue Culture Facility) for expert technical assistance, as well as Dr. Christine Nam and Ms. Seema Gunda for help with initial experiments. D.W.D. was supported by a Chemical Biology Interface Training Grant from the NIH (T32 GM066698).
Footnotes
Supporting Information Available: Synthetic and experimental details (PDF). This material is available free of charge via the Internet at http://pubs.acs.org
References
- 1.Davis AV, O'Halloran TV. Nat. Chem. Bio. 2008;4:148–151. doi: 10.1038/nchembio0308-148. [DOI] [PMC free article] [PubMed] [Google Scholar]
- 2.Camakaris J, Voskoboinik I, Mercer JF. Biochem. Biophys. Res. Commun. 1999;261:225–232. doi: 10.1006/bbrc.1999.1073. [DOI] [PubMed] [Google Scholar]
- 3.Barnham KJ, Masters CL, Bush AI. Nat. Rev. Drug. Discov. 2004;3:205–214. doi: 10.1038/nrd1330. [DOI] [PubMed] [Google Scholar]
- 4.Que EL, Domaille DW, Chang CJ. Chem. Rev. 2008;108:1517–1549. doi: 10.1021/cr078203u. [DOI] [PubMed] [Google Scholar]
- 5.Schlief M, Gitlin J. Mol. Neurobiol. 2006;33:81–90. doi: 10.1385/MN:33:2:81. [DOI] [PubMed] [Google Scholar]
- 6.Cobine PA, Pierrel F, Winge DR. Biochim. Biophys. Acta. 2006;1763:759–772. doi: 10.1016/j.bbamcr.2006.03.002. [DOI] [PubMed] [Google Scholar]
- 7.Turski ML, Thiele DJ. J. Biol. Chem. 2009;284:717–721. doi: 10.1074/jbc.R800055200. [DOI] [PMC free article] [PubMed] [Google Scholar]
- 8.Domaille DW, Que EL, Chang CJ. Nat. Chem. Bio. 2008;4:168–175. doi: 10.1038/nchembio.69. [DOI] [PubMed] [Google Scholar]
- 9.Bertini I, Rosato A. Cell. Mol. Life Sci. 2008;65:89–91. doi: 10.1007/s00018-007-7439-6. [DOI] [PMC free article] [PubMed] [Google Scholar]
- 10.Haas KL, Franz KJ. Chem. Rev. 2009;109:4921–4960. doi: 10.1021/cr900134a. [DOI] [PMC free article] [PubMed] [Google Scholar]
- 11.Yang LC, McRae R, Henary MM, Patel R, Lai B, Vogt S, Fahrni CJ. Proc. Natl. Acad. Sci. USA. 2005;102:11179–11184. doi: 10.1073/pnas.0406547102. [DOI] [PMC free article] [PubMed] [Google Scholar]
- 12.Zeng L, Miller EW, Pralle A, Isacoff EY, Chang CJ. J. Am. Chem. Soc. 2006;128:10–11. doi: 10.1021/ja055064u. [DOI] [PMC free article] [PubMed] [Google Scholar]
- 13.For select dosimeters, see: Dujols V, Ford F, Czarnik AW. J. Am. Chem. Soc. 1997;119:7386–7387.Viguier RFH, Hulme AN. J. Am. Chem. Soc. 2006;128:11370–11371. doi: 10.1021/ja064232v.Liu J, Lu Y. J. Am. Chem. Soc. 2007;129:9838–9839. doi: 10.1021/ja0717358.Zhou H, Ma X, Wang J, Zhang L. Org. Biomol. Chem. 2009;7:2297–2302. doi: 10.1039/b900167k.Weiying L, Lin Y, Wen T, Jianbo F, Lingliang L. Chem - Eur J. 2009;15:1030–1035.
- 14.For recent probes that operate in mixed aqueous solutions, see: Khatua S, Choi SH, Lee J, Huh JO, Do Y, Churchill DG. Inorg.Chem. 2009;48:1799–1801. doi: 10.1021/ic802314u.Ballesteros E, Moreno D, Gómez T, Rodríguez T, Rojo J, García-Valverde M, Torroba T. Org. Lett. 2009;11:1269–1272. doi: 10.1021/ol900050z.Huang J, Xu Y, Qian X. Org. Biomol. Chem. 2009;7:1299–1303. doi: 10.1039/b818611a.
- 15.Swamy KMK, Ko S-K, Kwon SK, Lee HN, Mao C, Kim J-M, Lee K-H, Kim J, Shin I, Yoon J. Chem. Comm. 2008:5915–5917. doi: 10.1039/b814167c. [DOI] [PubMed] [Google Scholar]
- 16.Jung HS, Kwon PS, Lee JW, Kim JI, Hong CS, Kim JW, Yan S, Lee JY, Lee JH, Joo T, Kim JS. J. Am. Chem. Soc. 2009;131:2008–2012. doi: 10.1021/ja808611d. [DOI] [PubMed] [Google Scholar]
- 17.Yu M, Shi M, Chen Z, Li F, Li X, Gao Y, Xu J, Yang H, Zhou Z, Yi T, Huang C. Chem - Eur J. 2008;14:6892–6900. doi: 10.1002/chem.200800005. [DOI] [PubMed] [Google Scholar]
- 18.Zhao Y, Zhang X-B, Han Z-X, Qiao L, Li C-Y, Jian L-X, Shen G-L, Yu R-Q. Anal. Chem. 2009;81:7022–7030. doi: 10.1021/ac901127n. [DOI] [PubMed] [Google Scholar]
- 19.Tsien RY, Poenie M. Trends Biochem. Sci. 1986;11:450–455. [Google Scholar]
- 20.Baruah M, Qin W, Vallee RAL, Beljonne D, Rohand T, Dehaen W, Boens N. Org. Lett. 2005;7:4377–4380. doi: 10.1021/ol051603o. [DOI] [PubMed] [Google Scholar]
- 21.Harris ED, Percival SS. Am. J. Clin. Nutr. 1991;54:1193S–1197S. doi: 10.1093/ajcn/54.6.1193s. [DOI] [PubMed] [Google Scholar]
Associated Data
This section collects any data citations, data availability statements, or supplementary materials included in this article.


