
Figure 1. Radiolytic protein footprinting experiments and data analysis.
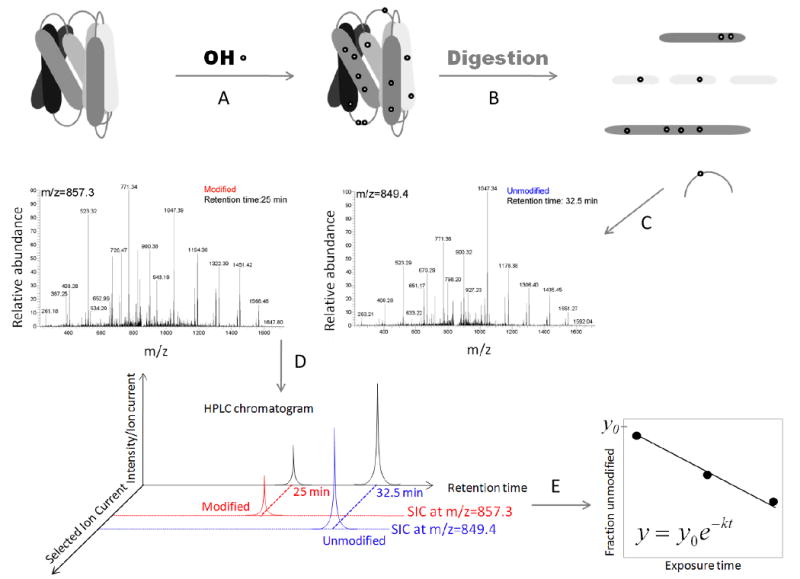
A) Proteins are exposed to X-rays for different time periods (ms). B) Following exposure the protein is digested with a protease and its fragments are separated by using reverse phase high-performance liquid chromatography coupled to a mass spectrometer. Searches for amino acid modifications such as +16 Da and other specific modifications (see Mechanisms of amino acid – OH· interactions) are performed using programs such as Mascot (Matrix Science) and ProtMapMS (57). C) Identification of the modified species based on its MS/MS spectra. D) The fraction unmodified is calculated by using the selected ion chromatogram peak area (modified in red and unmodified in blue). E) The fraction unmodified is plotted as a function of exposure time and the rate of modification is calculated by using nonlinear regression.