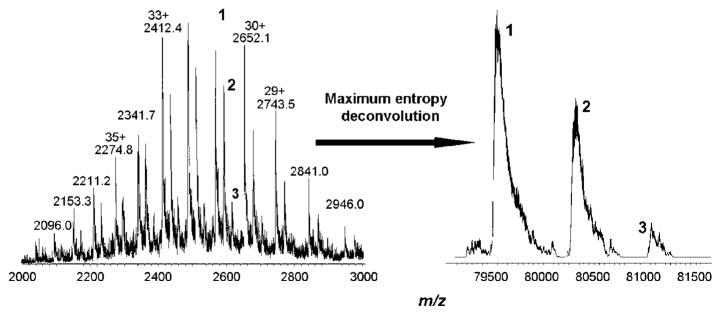
Figure 6.
Recorded (left) and maximum entropy deconvoluted (right) mass spectra of transferrin with 2-fold excess of 2c, recorded after 30 min of incubation in 20 mM ammonium carbonate buffer at 37 °C and pH 7.4. Peak 1 corresponds to the protein itself, peak 2 to the monoadduct (mass increase of ~760 Da), peak 3 to the bisadduct (mass increase of ~1520 Da).

