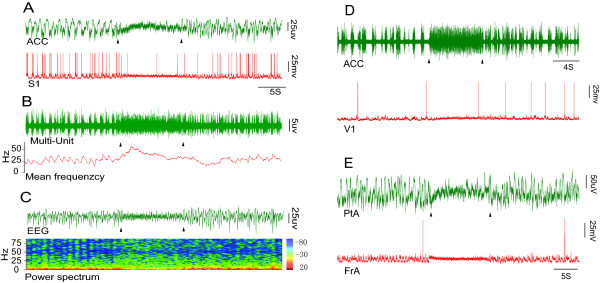
Figure 1.
Electrophysiological recordings from cortical areas during nociceptive stimulation. A, upper panel: Trace of the extracellular signal from the ACC, showing that the amplitude was reduced while the frequency was increased when a nociceptive stimulus was applied; lower panel: Intracellular trace from S1, showing that the Down state disappeared and the membrane potential (Vm) switched to a persistent Up state during nociceptive stimulation. B: The Multi-Unit signal was filtered from the upper panel in A. The spike firing rate of the MU signal was increased, and the Down state disappeared under nociceptive stimulation. C, upper panel: the trace filtered from A (upper panel), note that EEG waves switched to low-amplitude, high-frequency pattern activity; lower panel: The power spectrum of the corresponding EEG (C, upper panel), showing that the low frequency band was markedly reduced. D: The traces recorded from the ACC (upper panel) and from V1 (lower panel). E: The traces recorded from PtA (upper panel) and FrA (lower panel). Triangles signify the start and end of nociceptive stimulation. The color bar represents the proportion of EEG bands.

