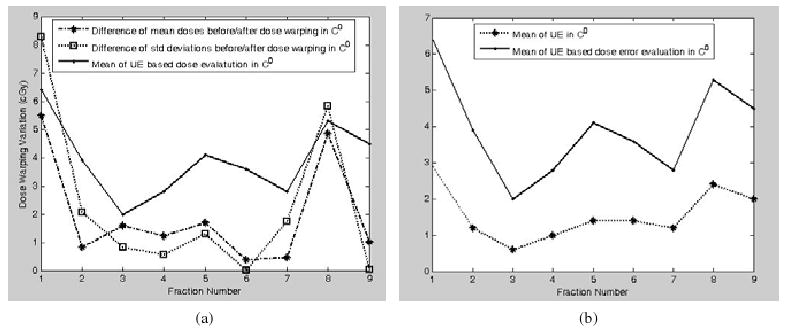
Figure 11.

(a) Dose-warping errors of nine fractions are represented as the differences of mean doses, the differences of standard deviations before and after dose warping, and the means of UE-based evaluation (8) in target contour 0; (b) the relation between the UE and the UE-based dose evaluation in the target contour C0 is illustrated.
