
Figure 2. Expenditures and Health Outcomes According to Various Production Functions.
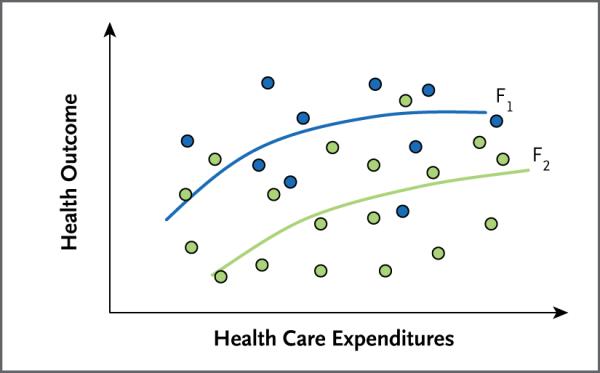
Shown is the relationship between expenditures and outcomes among various providers (circles) in managing a hypothetical condition. The blue circles represent providers who use a comparatively cost-effective mix of interventions for this condition, albeit at different levels of intensity (expenditure), and the green circles represent providers who use a less cost-effective mix of services. The curves F1 and F2 show the associations between expenditures and outcomes among providers who practice more (F1) or less (F2) cost-effective medicine.