
Figure 5.
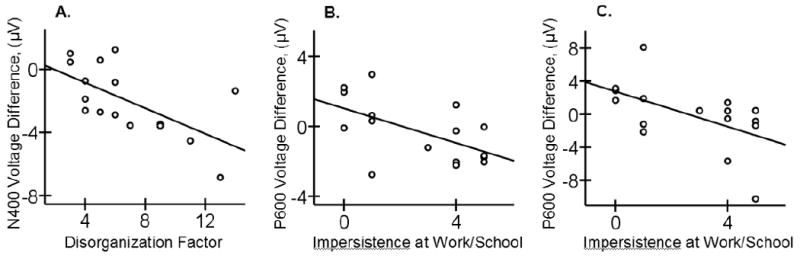
Scatter plots showing relationships in the patient group of the Disorganization factor scores to the N400 effect evoked to incongruous (vs. congruous) video endings (A), and of the Impersistence at Work or School to the P600 effect evoked to incongruous (vs. congruous) video endings (B) and to the P600 effect evoked to the less comprehensible incongruous (vs. congruous) video endings (C). Mean voltage differences in each time-window of interest were averaged across three electrode sites in the Frontal Midline region to quantify the N300 and the N400 effects and in the Parietal Midline region to quantify the P600 effect.