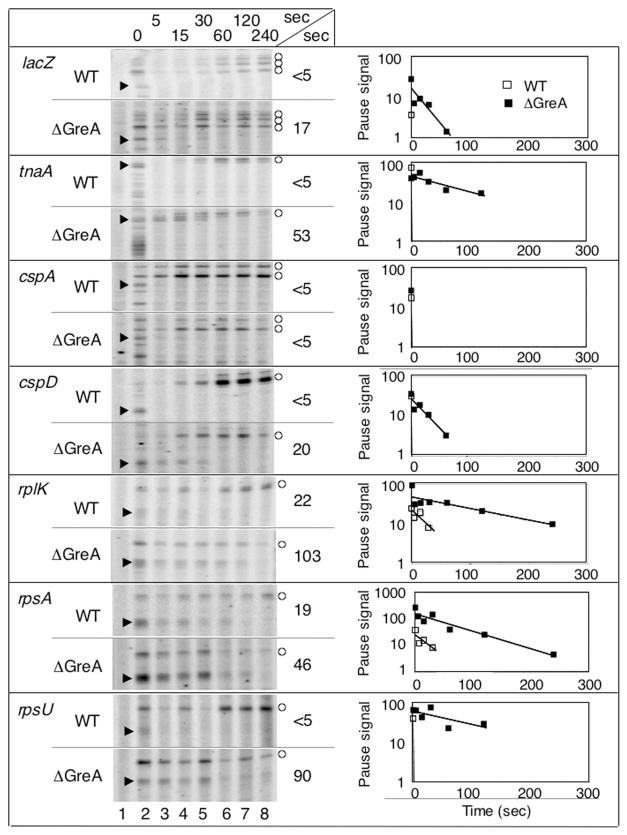
Fig. 5.
Comparison of RNAP stall duration in WT and ΔgreA cells using KMnO4 footprinting. Cells were untreated (lane 1), treated with KMnO4 alone (lane 2) or treated with rifampicin (rif) for 5, 15, 30, 60, 120 or 240 s prior to KMnO4 treatment (lanes 3–8 respectively). KMnO4-modified bases in the open complex are marked with open circles, while KMnO4-modified bases in the paused complex are marked with arrows; one marker may indicate a group of adjacent modified bases. In the plot to the right of each image, stall signal decay with time is shown for WT (open squares) and ΔgreA (closed squares) cells, and estimated half-lives derived from the plots are indicated.

