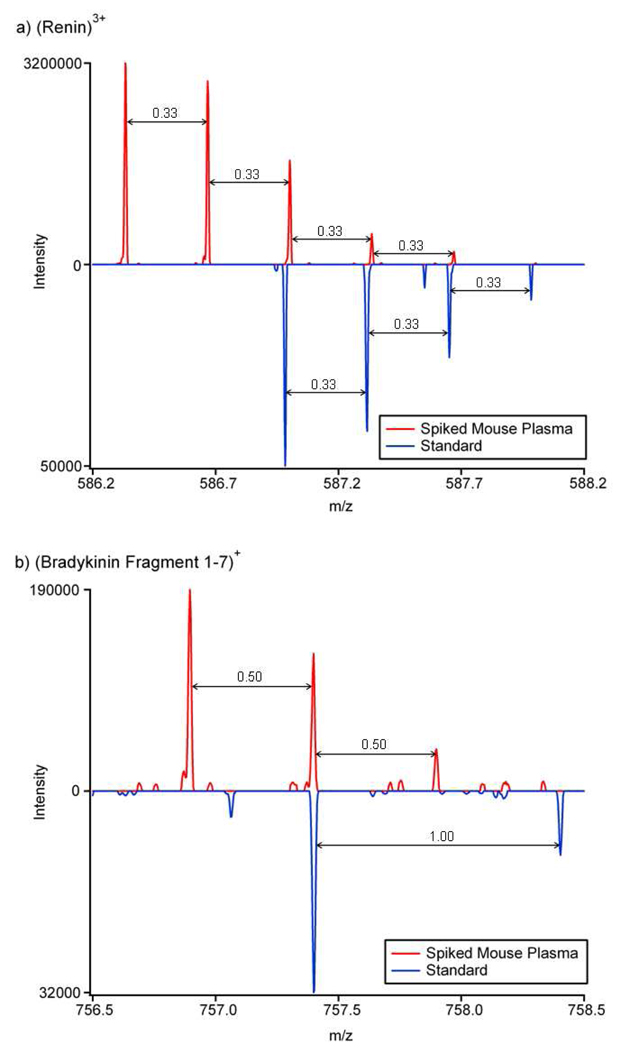
Figure 3.
The 15.5 minute LC-MS spectra of the 10 ng/mL peptides a) (renin)3+ and b) (bradykinin fragment 1–7)+. The inverted blue spectra from the standard sample show the correct m/z and isotopic data for each peptide, while the red spectra from the mouse plasma sample show the spectra for the elution time when the spiked peptides should be observed.

