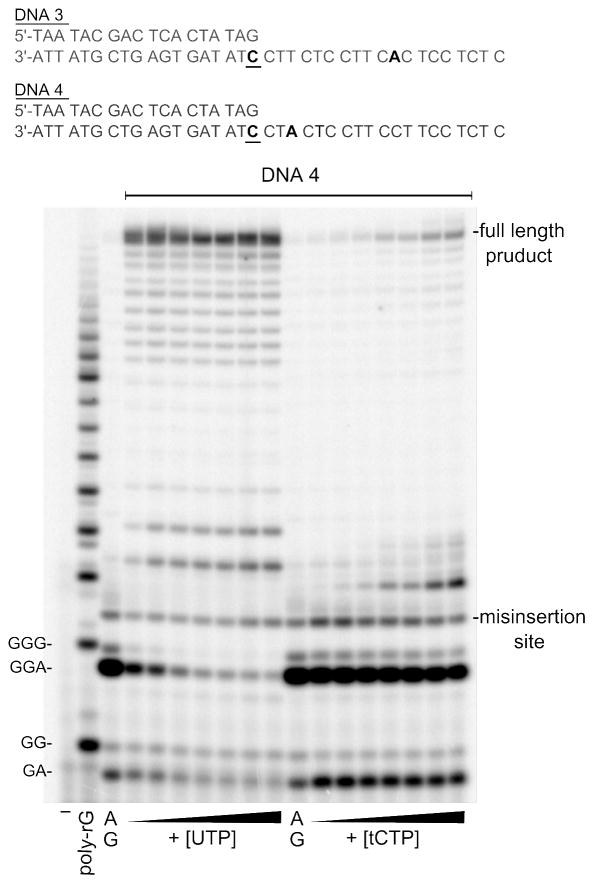
Figure 3.
Incorporation of UTP and tCTP across from a template A. All reactions contained 0.2 units/μl T7 RNAP, 1 μM DNA4, 0.4 mM GTP, 0.4 mM ATP, some α-[32P]-GTP and increasing concentrations of UTP (left side) or tCTP (right side). Each reaction was stopped after 30 min. The UTP and tCTP concentrations, respectively, were as follows: 1, 5, 10, 25, 50, 100, 200 μM.

