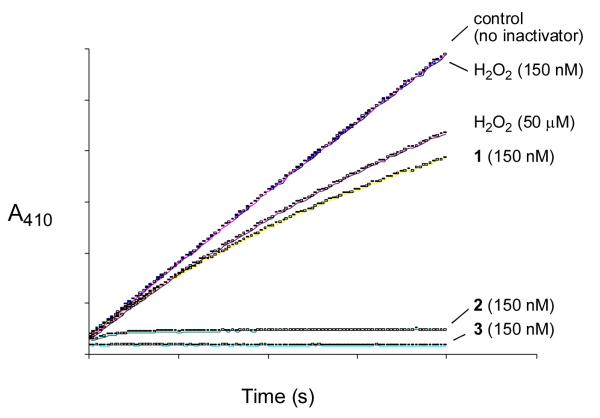
Figure 3.
Comparision of the inactivation of PTP1B by compounds 1, 2, 3, and hydrogen peroxide. Thiol-free PTP1B (25 nM) was added to a cuvette containing 3,3-dimethyl glutarate buffer (50 mM, pH 7.0), p-NPP (10 mM), and the hydroperoxide of interest (1, 2, 3, or H2O2) at 24 °C. Enzyme inactivation progress curves showing the amount of PTP1B activity remaining as a function of time were obtained by monitoring the enzyme-catalyzed release of p-nitrophenolate ion from the substrate p-NPP at 410 nm. Note: curves for control “no inactivator” and 150 nM H2O2 are overlapping.

