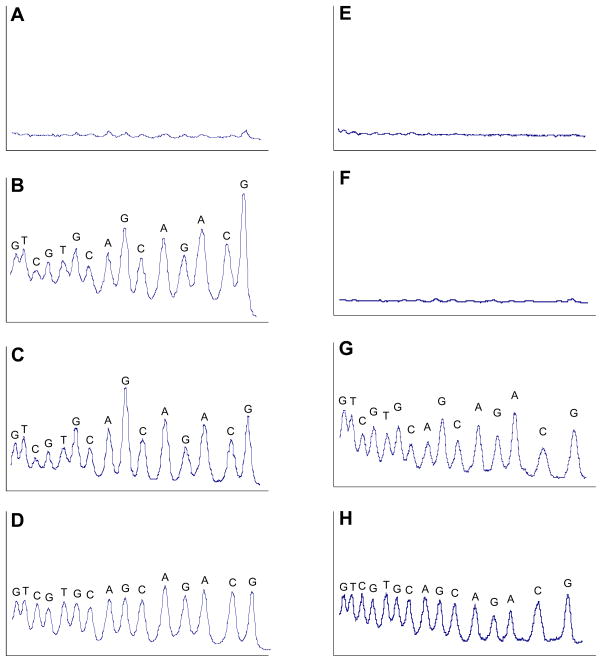
Figure 5. Left side, A–D.
Comparison of DNA-cleavage patterns generated by enzymatically-activated TPZ, 5, and iron-EDTA. (A) Control; NADPH:cytochrome P450 reductase enzyme system (no 5), (B) TPZ activated by NADPH:cytochrome P450 reductase enzyme system under anaerobic conditions, (C) compound 5 activated by NADPH:cytochrome P450 reductase enzyme system under anaerobic conditions and, (D) the hydroxyl radical-generating Fe-EDTA system under aerobic conditions. DNA cleavage reactions were performed on a 30 base pair 5′-32P-labeled oligodeoxynucleotide duplex as described in the Experimental Section. Densitometer scans are from a portion of a 20% denaturing polyacrylamide gel and show the relative intensity of DNA cleavage at each base position. Lanes A, B and C were loaded with equal amounts (cpm) of labeled DNA and are plotted on the same vertical scale. Lane D, provided for comparison, is not plotted on the same vertical scale as A, B, and C. Right side, E–H. Comparison of DNA-cleavage patterns generated by enzymatically-activated TPZ and hydroxyl radical generated by the anaerobic photolysis of H2O2 in sodium phosphate buffer containing 40 mM NaCl. (E) Control, DNA treated with the NADPH:cytochrome P450 reductase enzyme system under anaerobic conditions in the absence of TPZ (F) Control, DNA subjected to photolysis under anaerobic conditions, (G) TPZ activated by NADPH:cytochrome P450 reductase enzyme system under anaerobic conditions in the same buffer and salt conditions employed for the peroxide photolysis, (H) DNA strand cleavage by hydroxyl radical generated via photolysis of H2O2. Lanes E and G and F and H were loaded with equal amounts (cpm) of labeled DNA and are plotted on the same vertical scale so they can be compared.

