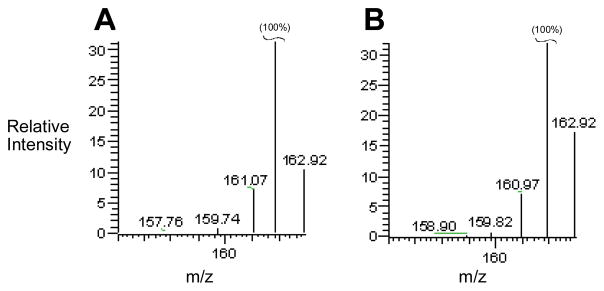
Figure 7.
In vitro metabolism of 5 in deuterated buffer and in the presence of deuterated solvents CD3OD and D2O does not lead to incorporation of deuterium in the metabolite 8. Panel A shows mass spectrometric data obtained by ESI-LC/MS analysis of authentic (protio) 8 in the positive ion mode. The base peak at m/z 162 is the (M+H)+ ion of 8. The peak at m/z 162.9 is due to natural abundance of 13C, 15N, and 2D in the molecule and is close to the expected value of 10% of the base peak. Panel B shows mass spectrometric data obtained by LC/MS analysis of the mono-N-oxide metabolite generated by incubation of 5 (800 μM) with NADPH:cytochrome P450 reductase (0.6 units/mL) and NADPH (3 mM) in deuterated sodium phosphate buffer (50 mM, pD 6.6) and deuterated methanol (CD3OD, 2 M) under anaerobic conditions for 12 h. The small increase in the peak at m/z 163 may indicate that approximately 2–5% deuterated metabolite (12) was produced during one-electron reduction of 5.

