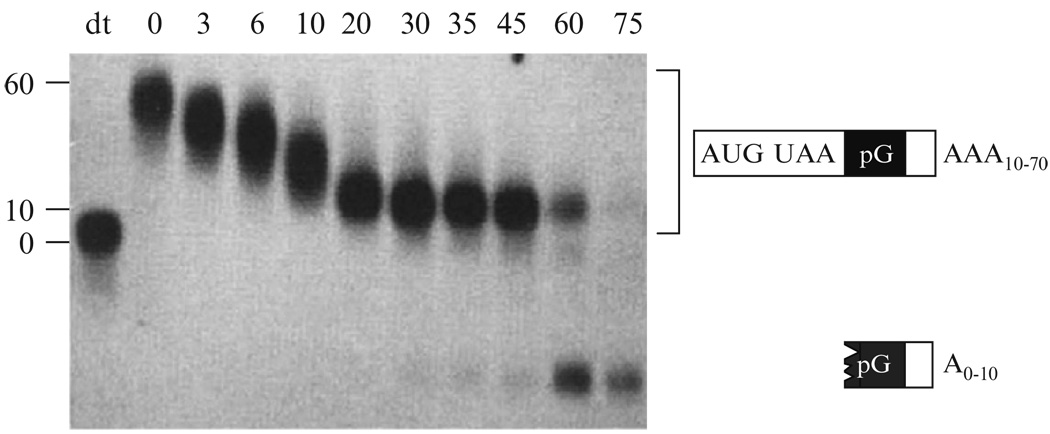
Figure 20.2.
Example of a transcriptional pulse–chase experiment. The figure shows Northern blot analysis of a transcriptional pulse–chase experiment with PGK1 mRNA containing a poly(G) tract inserted into its 3′ UTR. After transcriptional repression, samples were taken at different times shown on the top. The first lane (dT) specifies sample treated with oligo d(T) and RNase H to remove the poly(A) tail. At later time points, an intermediate of mRNA decay trapped by the presence of the poly(G) tract in the 3′ UTR can be seen to accumulate.

