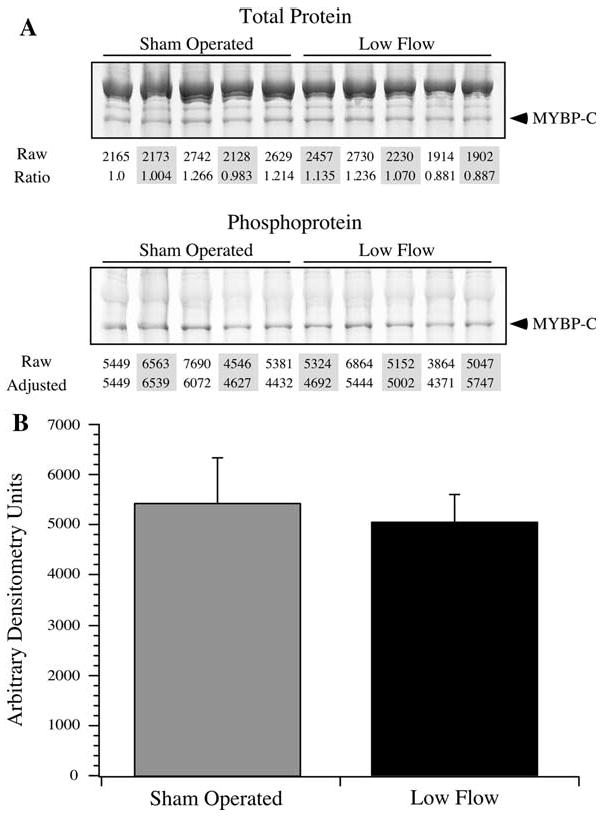
Fig. 4.

Phosphorylation of MYBP-C. The extent of MYBP-C phosphorylation was determined by phosphoprotein staining. a Sham operated and low flow samples were resolved by SDS-PAGE and stained for total protein and phosphoprotein. The MYBP-C signals were quantified by densitometry (marked “Raw”), and were normalized to the first sham operated sample, providing a normalization factor across samples (marked “Ratio”). This ratio was applied to the unadjusted MYBP-C phosphoprotein signals (marked “Raw”) to provide a normalized value of the extent of MYBP-C phosphorylation. b The average ± SD of the normalized phosphorylated MYBP-C densitometry values are presented. There was no statistically significant difference between sham operated and low flow samples
