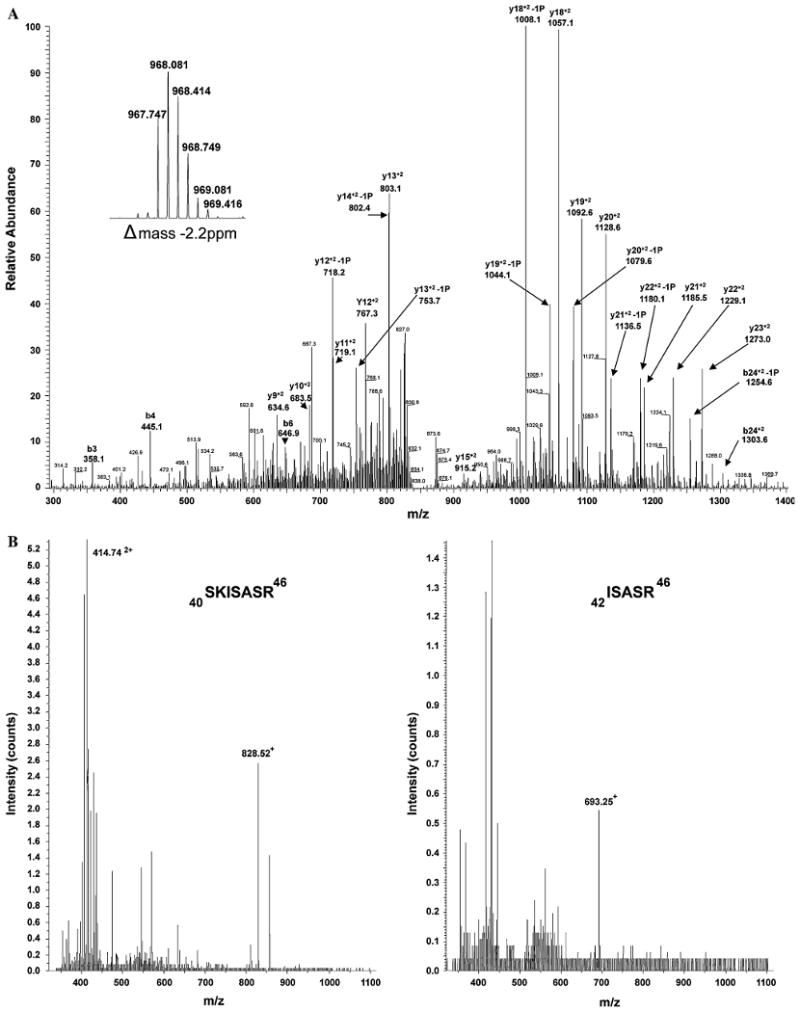
Fig. 7.

Mass Spectrometry analyses of TnI. To determine the sites of phosphorylation of TnI, mass spectrometry was used to analyze an enriched low blood flow TnI preparation. a Tandem MS spectra of the chymotrypsin generated parent ion 967.7 [M + 3H] 3+ highlighting b and y ions corresponding to phosphorylated Ser23 and 24. The inset scan is part of the Orbitrap FT full scan at 60,000 resolution, showing the parent ion. The delta mass of the parent ion is −2.2 ppm. b LC-MS spectra of trypsin digested TnI representing m/z consistent with the monophosphorylated peptide 40SKISASR46 with net +1 and +2 charge (Left) and the diphosphorylated peptide 42ISASR46 with net +1 charge (Right)
