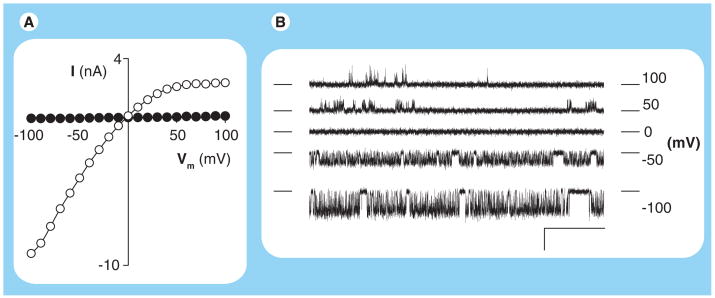
Figure 1. Plasmodial surface anion channel activity at a range of membrane potentials detected with patch clamp.
(A) Current–voltage profile from whole-cell recordings of an uninfected erythrocyte and a cell infected with a Plasmodium falciparum trophozoite (black and white circles, respectively). Notice that the infected cell has larger currents at each Vm. (B) Single plasmodial surface anion channel recordings in the cell-attached patch-clamp configuration. All traces were recorded from a single patch with imposed Vm values indicated to the right of each trace. For each trace, the closed channel level is indicated with horizontal dashes on each side. Channel openings are reflected by transitions away from this level; these transitions are upgoing at positive Vm and downgoing at negative Vm. Scale bar represents 100 ms (horizontal) and 2 pA (vertical). Notice that plasmodial surface anion channel openings are more frequent at negative Vm, consistent with greater absolute magnitudes of whole-cell currents at negative Vm in (A). Recordings were obtained with symmetrical molar salt solutions as described previously [15].
I: Current; Vm: Membrane potential.

