Fig. 2.
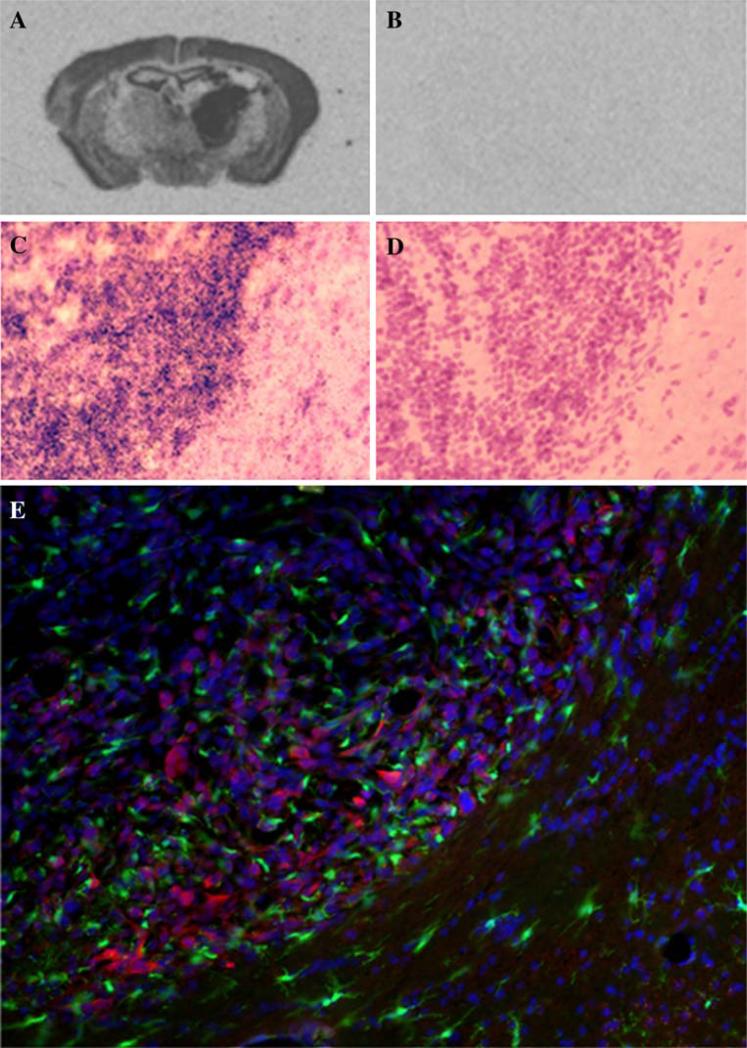
Hn1 is expressed in GL261 brain tumors of C57BL/6 mice. Sections were derived from tumor bearing brains 20 days post-GL261 cell implantation. Panels a–b depict low resolution ISH analysis of Hn1 mRNA in GL261 tumors using anti-sense (a) and sense (b) Hn1 riboprobes. Panels (c–d) depict higher resolution silver grain analysis of adjacent sections from a GL261 brain tumor hybridized with anti-sense (c) and sense (d) Hn1 riboprobes. High silver grain density on the left side of the section indicates Hn1 expression within the tumor cells. Sections were counterstained with H&E following ISH. (e) Immunohistochemical analysis using a rabbit polyclonal anti-Hn1 antibody showing Hn1 (red) in the GL261 tumor cells and not the GFP-expressing microglia (green). Sections were counterstained with DAPI nuclear stain (blue)

