
Fig. 2. The ALDEFLUOR-positive cell populations from breast cancer cell lines (MDA-MB-453, SUM159) have cancer stem cell properties.
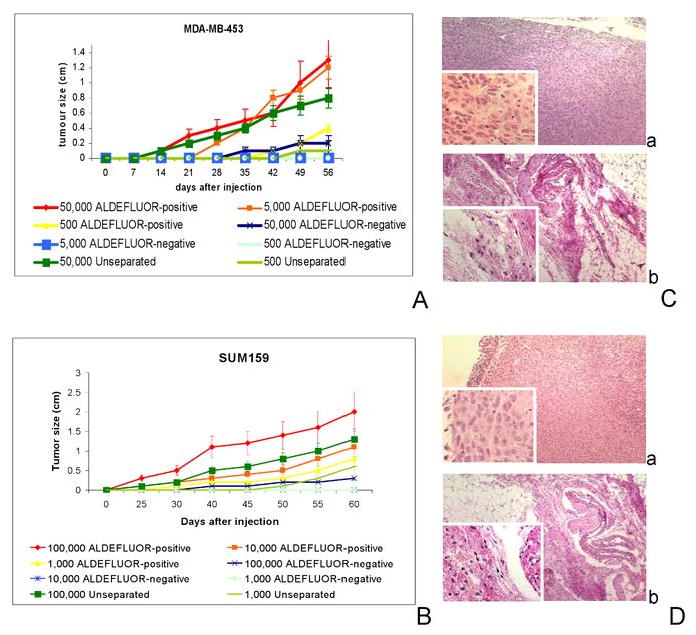
A-B. Tumor growth curves were plotted for different numbers of cells injected (for MDA-MB-453: 50,000 cells, 5,000 cells, and 500 cells and for SUM159: 100,000 cells, 10,000 cells, and 1,000 cells) and for each population (ALDEFLUOR-positive, ALDEFLUOR-negative, unseparated). Tumor growth kinetics correlated with the latency and size of tumor formation and the number of ALDEFLUOR-positive cells. C-D. H&E staining of ALDEFLUOR-positive cells' injection site, revealing presence of tumor cells (Ca: MDA-MB-453 ALDEFLUOR-positive cells' injection site, and Da: SUM59 ALDEFLUOR-positive cells' injection site). Cb, Db. The ALDEFLUOR-negative cells' injection site contained only residual Matrigel, apoptotic cells, and mouse tissue (Cb: MDA-MB-453 ALDEFLUOR-negative cells' injection site, and Db: SUM59 ALDEFLUOR-negative cells' injection site). Data represent mean ± SD.