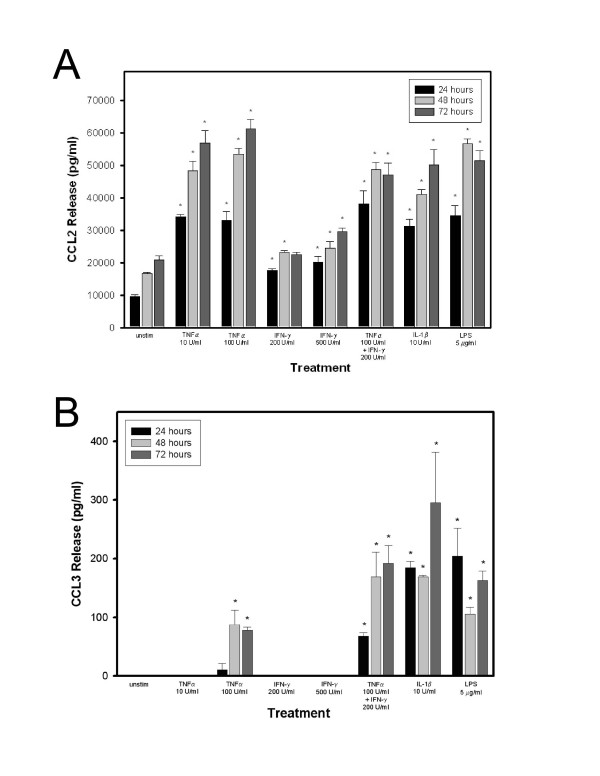
Figure 4.
Quantitation of CCL2 and CCL3 release by resting and cytokine stimulated HBMEC by ELISA. (A) Detection of CCL2 protein in supernatants of HBMEC cultures under resting conditions and following incubation with cytokines and LPS. Chemokine release was determined by sandwich ELISA at the indicated time intervals. Values represent mean release (pg/ml) ± SEM (n = 3). Tukey test p ≤ 0.001; * p < 0.05 as compared to unstimulated HBMEC. Values shown represent one of two independent, representative experiments. (B) Detection of CCL3 protein in supernatants of resting HBMEC cultures and monolayers treated with cytokines and LPS. Chemokine release was determined by sandwich ELISA at the indicated time intervals. Values represent mean release (pg/ml) ± SEM (n = 3). ANOVA p ≤ 0.001; * p < 0.05 as compared to unstimulated HBMEC. Values shown are the results of one of two independent, representative experiments.

