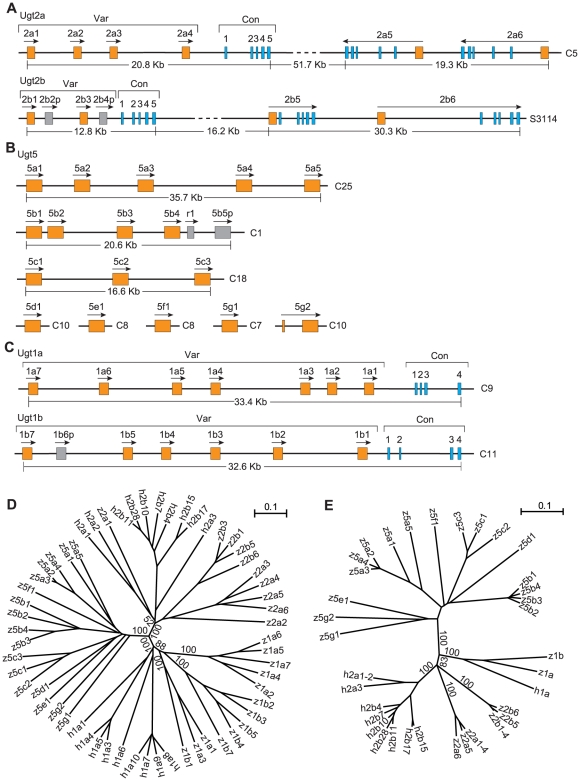
Figure 1. The repertoire of the zebrafish Ugt genes.
Shown are the genomic organizations of the zebrafish Ugt 2a and 2b clusters (A), the Ugt5 genes (B), and the Ugt 1a and 1b clusters (C). Orange boxes represent variable exons or Ugt5 exons, and blue boxes represent constant exons. Gray boxes represent pseudogenes (p) or relics (r). The approximate length for each cluster is also shown. Transcription directions are indicated by an arrow above each gene. Chromosomal or scaffold locations are shown on the right by the letter “C” representing chromosome or “S” representing scaffold. Var, variable; Con, constant; Kb, kilobase pairs. The phylogenetic trees are based on the polypeptide sequences encoded by the zebrafish (z) and human (h) variable regions (D) or constant regions (E). The trees are unrooted. The tree branches are labeled with the percentage support on the basis of 1,000 bootstrap replicates. Only bootstrap values (>50%) of the major nodes are shown. The scale bar equals a distance of 0.1.

