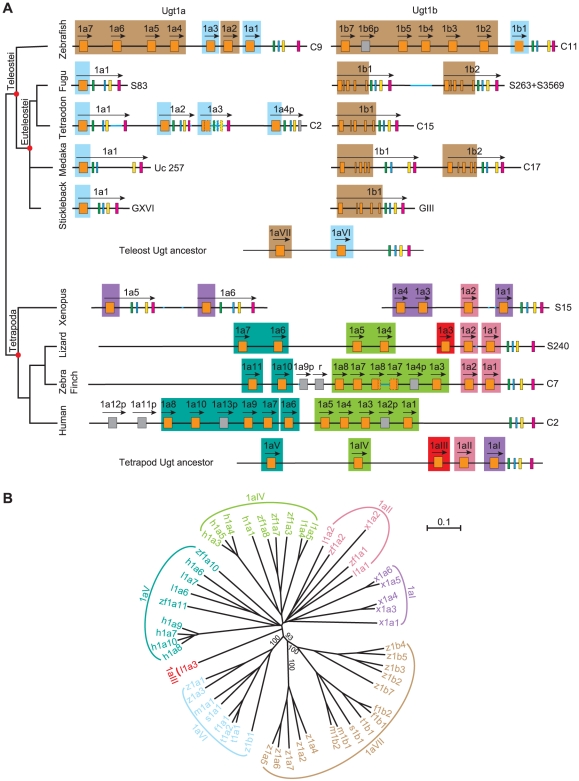
Figure 3. The evolution of the vertebrate Ugt1 genes.
(A) Comparison of the vertebrate Ugt1 clusters with species names indicated on the left. The exons are indicated by boxes with different colors. Pseudogene (p) and relic (r) are indicated by gray boxes. The directions of transcription are indicated by arrows. Chromosomal or scaffold locations are shown on the right. Small gaps are represented by light blue lines and possible exons in the gaps by dotted boxes. The hypothetical ancestral teleost and tetrapod Ugt1 clusters are shown with orthologous variable exons shaded in the same background color. (B) Phylogenetic tree of the zebrafish (z), fugu (f), tetraodon (t), medaka (m), stickleback (s), xenopus (x), lizard (l), zebra finch (zf), and human (h) Ugt1 genes. The tree branches are labeled with the percentage support on the basis of 1,000 bootstrap replicates. Only bootstrap values (>50%) of the major nodes are shown. The trees are unrooted. The scale bar equals a distance of 0.1. The seven Ugt1 groups (1aI to 1aVII) are indicated with the same color as shaded in the panel A.

