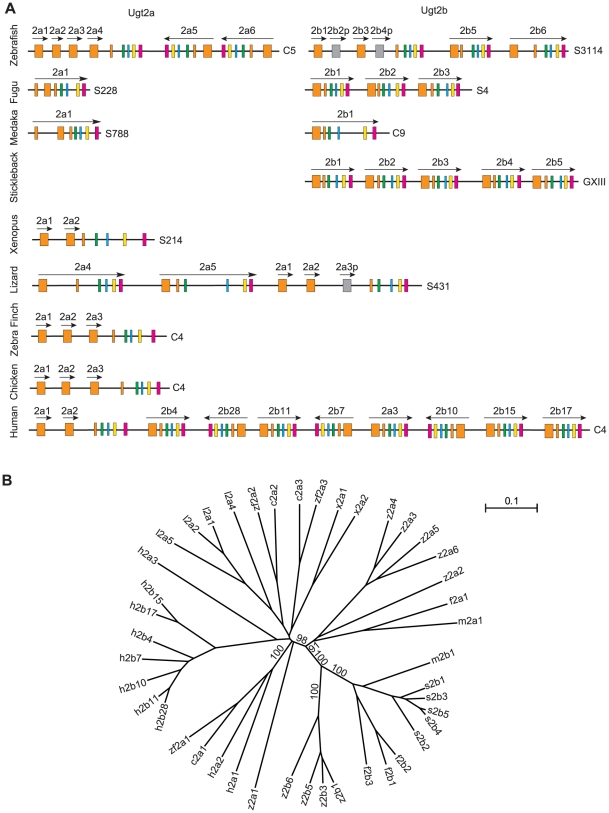
Figure 4. The evolution of the vertebrate Ugt2 genes.
(A) Comparison of the vertebrate Ugt2 clusters with species indicated on the left. The exons are indicated by boxes with different colors. Pseudogenes (p) are indicated by gray boxes. The directions of transcription are indicated by arrows. Chromosomal or scaffold locations are shown on the right. (B) Phylogenetic tree of the zebrafish (z), fugu (f), medaka (m), stickleback (s), xenopus (x), lizard (l), zebra finch (zf), and human (h) Ugt2 genes. The trees are unrooted. Bootstrap values (>50%) of only the major nodes are shown. The scale bar equals a distance of 0.1.

