
Figure. Absolute and Relative Mean Changes in Telomere Length Over 5 Years by Quartile of Omega-3 Fatty Acid Level, Adjusted for Age and Baseline Telomere Length.
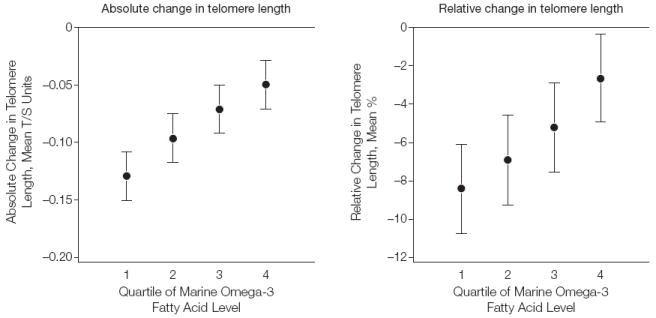
Error bars indicate 95% confidence intervals. T/S indicates telomere-to-single-copy gene ratio. P<.001 for linear trend for both absolute and relative change. See Table 1 for definitions of quartiles.