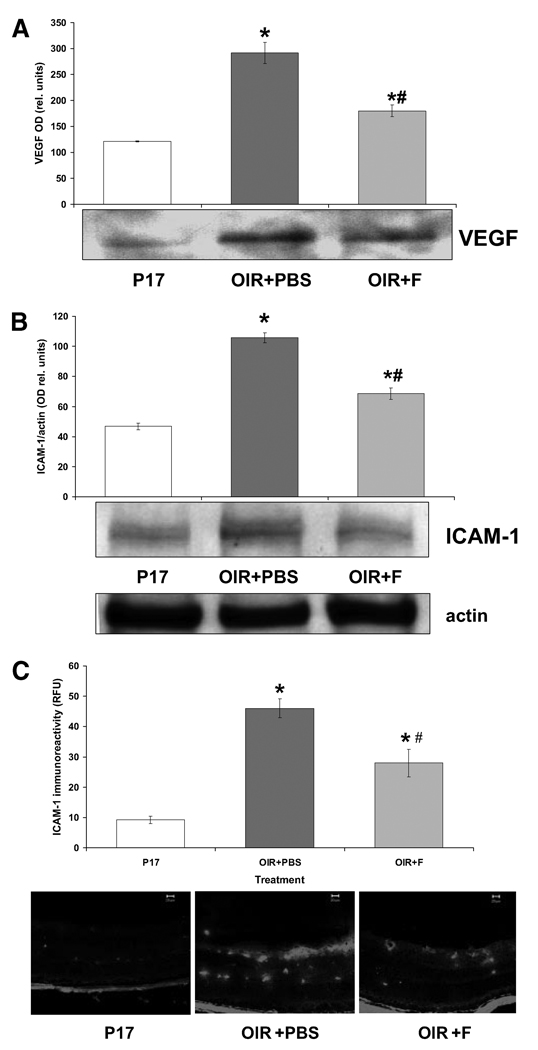
FIGURE 4.
Measurement of VEGF and ICAM-1 expression by Western blot and immunohistochemical analyses. (A) Immunoblots showing VEGF-specific immunoreactivity and quantified as measurements of optical density (histogram). *P < 0.01 vs. P17; #P < 0.01 vs. OIR+PBS; x = mean ± SE; n = 5. (B) Immunoblot showing ICAM-1–specific immunoreactivity and measured as optical density units relative to actin. *P < 0.01 vs. P17; #P < 0.01 vs. OIR+PBS; x = mean ± SE; n = 5. (C) Immunohistochemical analysis demonstrating ICAM-1–specific immunofluorescence (FITC) and quantified by morphometric analysis (bar histograms). *P < 0.01 vs. P17; #P < 0.01 vs. OIR_PBS; x = mean ± SE; n = 3.

