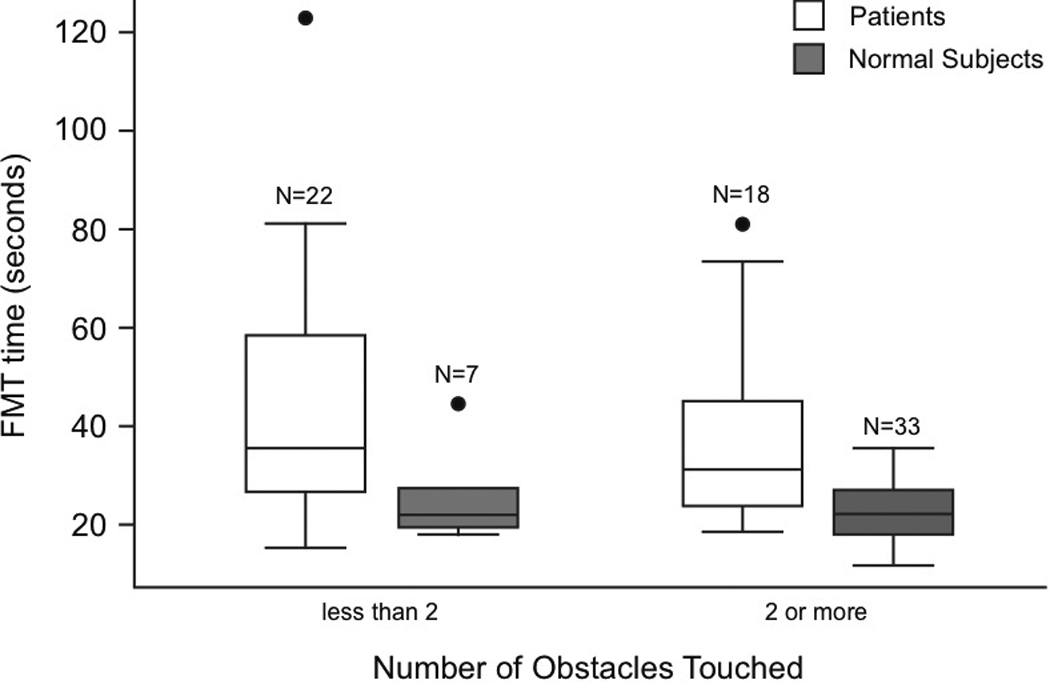
Figure 3.

Comparison of FMT time vs. obstacles for normal controls and patients. Horizontal lines of the boxes are 25th, 50th (median) and 75th percentiles. The lines that extend from the top and bottom of the box display the lowest and highest observations that are inside the region defined by the 25th percentile minus 1.5 * inter-quartile range (75th - 25th percentiles) and the 75th percentile plus 1.5 * inter-quartile range. Circles are outliers.
