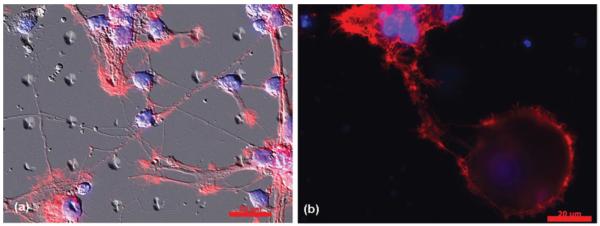
Fig. 5.
Optical micrographs of hippocampal neurons plated on glass substrates patterned with PDMS conical features. (a) A brightfield micrograph of a 10 μm diameter by 10 μm spacing PDMS pattern overlaid onto an optical fluorescence micrograph (to aid in visualization of the pattern) of the neuronal network, highlighting the preference of both the soma and processes to maximize interactions with the PDMS posts. (b) The fluorescence micrograph of neurons on a 50 μm diameter by 100 μm spacing PDMS pattern highlights similar behavior of the soma but distinct behavior in regards to process outgrowth; in the latter case, process wrapping dominates the outgrowth behavior. Also, in (b) a cell soma can be seen attached to the top of the PDMS post. In these, images, Rhodamine-phalloidin stains the actin in the cytoskeleton red, while DAPI stains the DNA in the nucleus blue. Scale bar is 20 μm.

