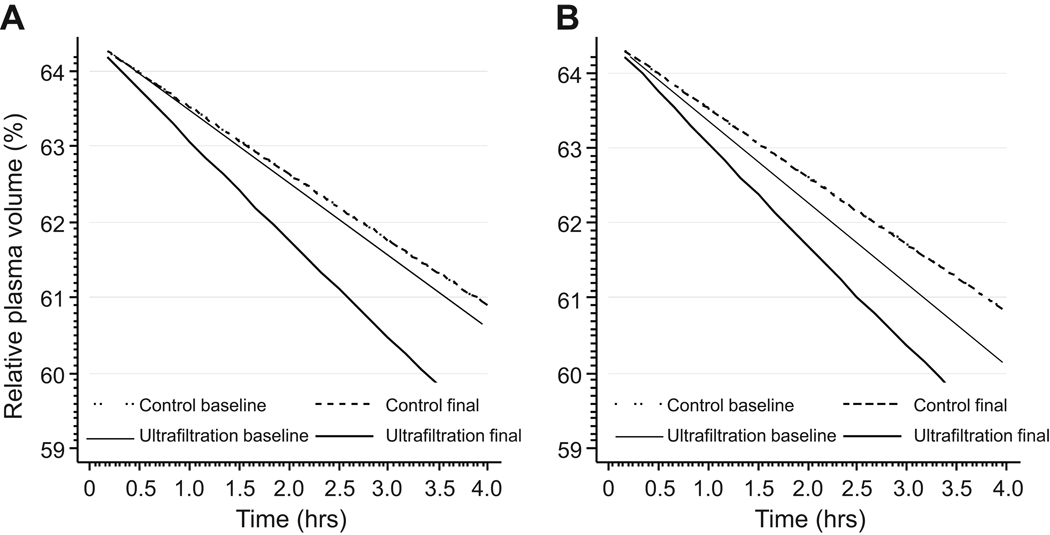
Figure 1.
Panel A: Modeled changes in relative plasma volume (RPV) among the two groups of patients: control and ultrafiltration. The broken lines represent the control group and the solid lines ultrafiltration group. In the control group or ultrafiltration groups, RPV intercepts were similar at baseline and unchanged at final visit. The control group at baseline had an RPV slope of 1.40 %/hr. There was no change in RPV slope (1.40%/hr) at final visit. Accordingly, the two lines are superimposed on each other. The ultrafiltration group at baseline had an RPV slope of 1.53%/hr (NS from baseline control). The RPV slope significantly (p<0.001) steepened to 2.09%/hr at final visit. Panel B: Modeled RPV slopes adjusted for post-dialysis weight changes from baseline to end of study. Similar changes as unadjusted model were seen suggesting that changes in RPV slope persist even after accounting for changes in body weight.

