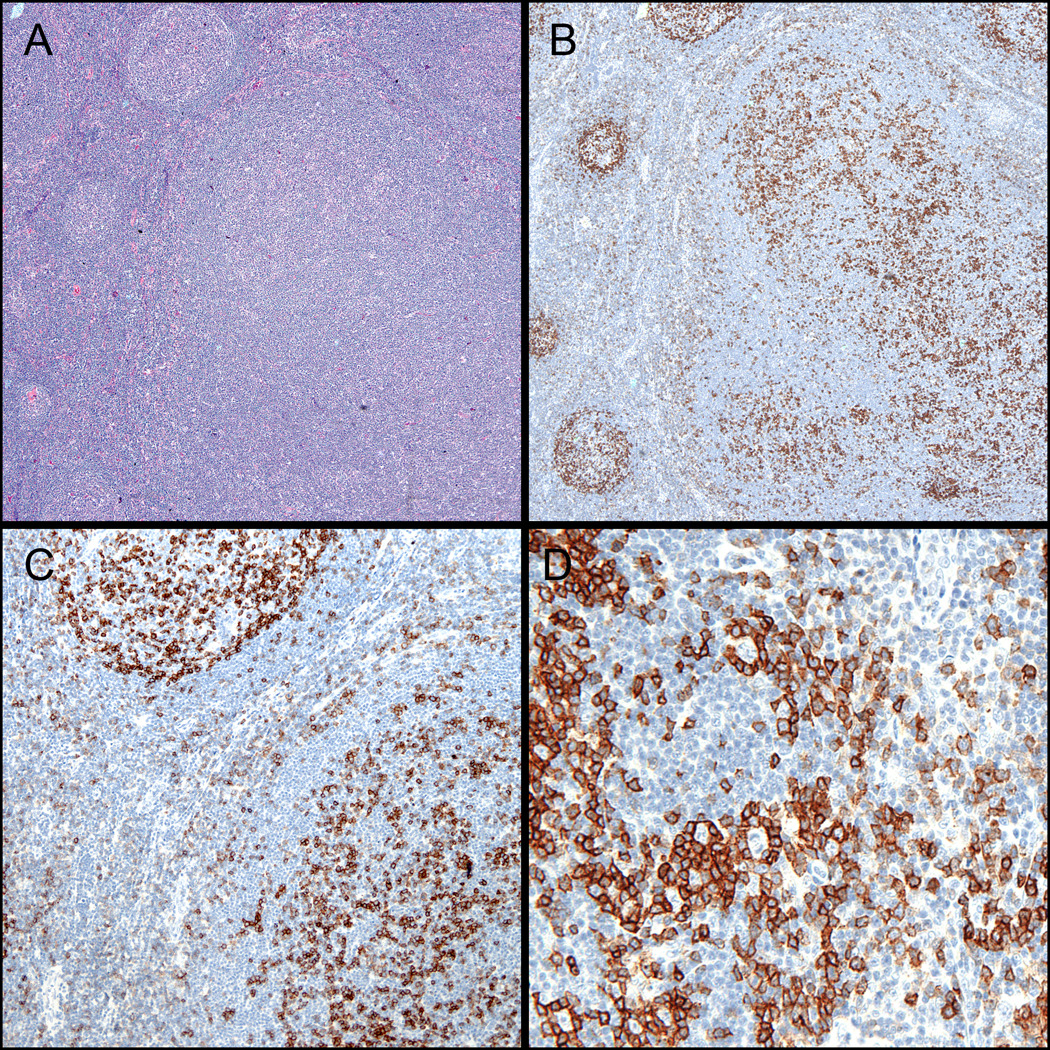
Figure 4. PD-1 patterns in PTGC and NLPHL.

(A) PTGC – note the prominent nodule with disrupted germinal center adjacent to reactive follicles (H&E, 100x). (B) PD-1 staining is increased within the PTGC nodules (100X). (C) PD-1 staining is also increased in the paracortical zones surrounding the PTGC nodules (200x). (D) PD-1-positive GC-T-cell rosettes are clearly highlighted in a case previously diagnosed as florid PTGC but was found to have focal involvement by NLPHL (400X).
