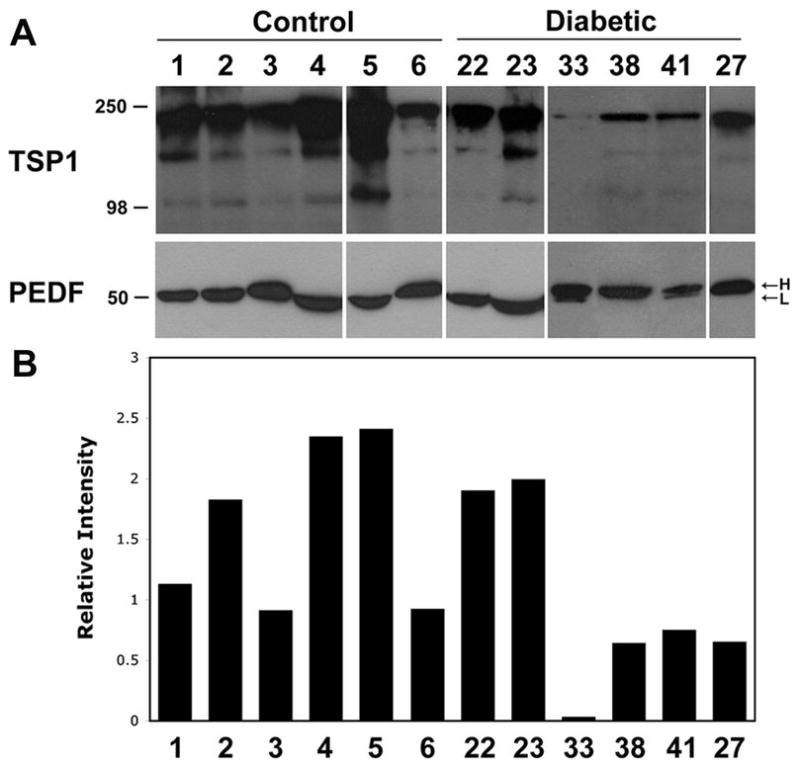
Figure 1.

Determination of TSP1 and PEDF levels in vitreous samples. The level of TSP1 and PEDF, in vitreous samples prepared from control or diabetic patients was determined by Western blot analysis. A representative set of samples from control and diabetic groups is shown in A. Please note the wide variation in the levels of TSP1 in diabetic samples compared to control. Minimal variation was observed in the level of PEDF. PEDF varied in its molecular weight among the samples (L, lower molecular weight; H, high molecular weight). Please note samples from diabetic patients with high molecular weight PEDF isoform express significantly less TSP1 compared to samples expressing the low molecular weight isoform of PEDF. For quantitative assessment of the data shown in A, the TSP1 band intensities relative to PEDF were determined as described in Methods and shown in B. The results from the remaining samples are presented in a summary format in Tables 1 and 2.
