
Figure 3.
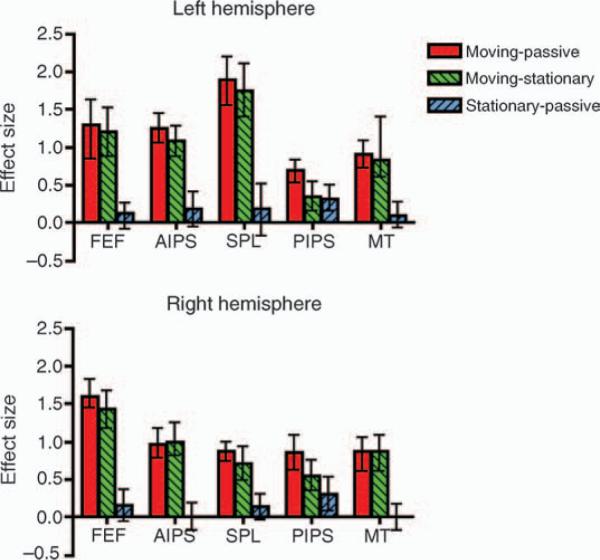
An ROI analysis for each of the 10 brain areas (5 in each hemisphere) for the three possible contrasts. AntIPS = anterior intraparietal sulcus, FEF = frontal eye fields, MT+ = medial temporal complex and SPL = superior parietal lobule. The error bars represent 95% confidence intervals, not corrected for multiple comparisons.