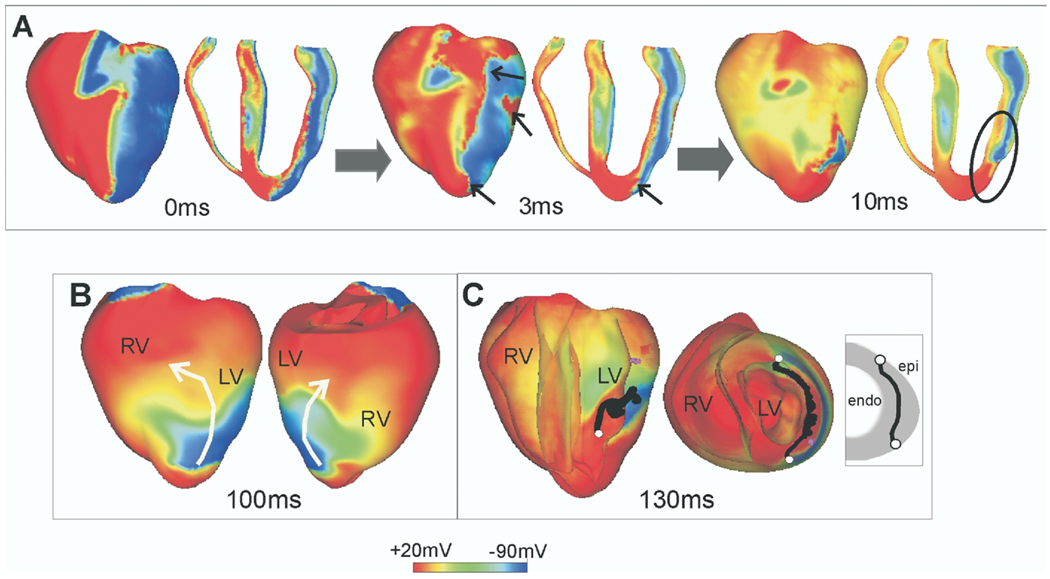
Figure 2.
Postshock transmembrane potentials in the rabbit ventricles. Time is counted from the end of the shock. A: Virtual electrode polarization at shock-end and activity at 3 and 10 ms postshock, demonstrating break excitations (small arrows) and propagation through the postshock excitable areas (encircled region). B: Shock-induced arrhythmia in the rabbit ventricles. White arrows indicate the direction of propagation of the reentrant waves. C: Postshock scroll-wave filaments (shown in black). The ends of the filaments are shown in white and are in touch with the same surface, the epicardium (U-type filaments). Inset shows schematic of filament location. LV = left ventricle; RV = right ventricle.

