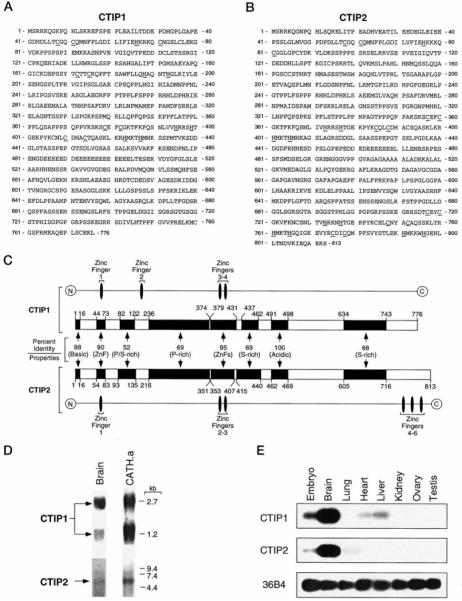
Fig. 2. Amino acid sequence, diagram of amino acid sequence alignment, and expression of CTIP1 and CTIP2 in several mouse tissues.
A and B, amino acid sequence of CTIP1 and CTIP2, respectively. The conserved cysteine and histidine amino acids contributing the C2H2 and C2HC zinc finger motifs of both proteins are underlined. C, schematic diagram of CTIP1 and CTIP2 amino acid alignment. The homologous regions are represented by black boxes and the percentage of identity between each region of CTIP1 and CTIP2 is indicated. The alignment was performed using Clustal X (version 1.63b). The overall characteristics of each domain are indicated. D, Northern blot analysis of CTIP1 and CTIP2 expression in brain and CATH.a cells. Approximately 5 μg of brain and 10 μg of CATH.a poly(A)+ RNA were loaded per lane, and the blots were hybridized with probes derived from the 3′-end of both CTIP1 and CTIP2. E, Southern blot of reverse transcription-polymerase chain reaction analysis of RNA from various tissues of adult mouse and embryo (10–12.5 days postcoitum. Note that partial EST clones of both CTIP1 and CTIP2 have been reported (mi17e04.r1 and mv64 h01.r1, respectively, from the Washington University-HHMI Mouse EST Project).

