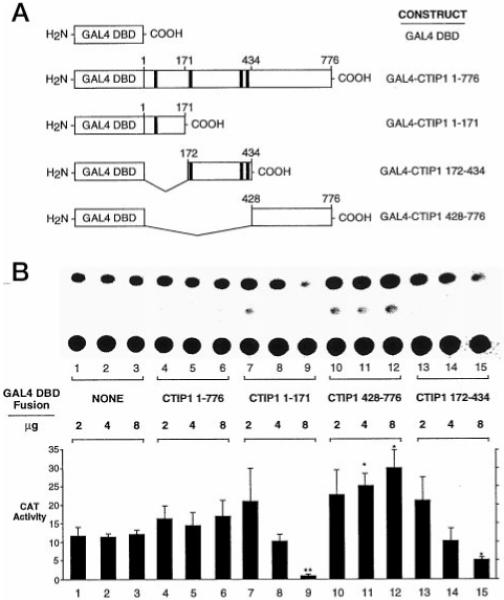
Fig. 7. Autonomous transcriptional modulatory activity of CTIP1.

A, diagram of GAL4 DBD-CTIP1 fusion constructs used in the transfection experiments illustrated in B. The black boxes represent the zinc finger motifs of CTIP1. B, CAT assays using extracts of HEK293 cells transiently transfected with 7.5 μg of the (17-mer)5 reporter (pG5CAT, CLONTECH) and the indicated amounts of expression vectors for GAL4 DBD (pM; CLONTECH) or GAL4 DBD-CTIP1 fusion proteins. Statistically significant effects are indicated by asterisks (p < 0.05, Student’s t test) or double asterisks (p < 0.01) when comparing GAL4-CTIP fusions to the corresponding amount of transfected GAL4 DBD. Note that the quantitation shown represents the mean ± S.D. of CAT activities from six independent experiments, whereas the CAT assay shown in B is from a single, representative experiment.
