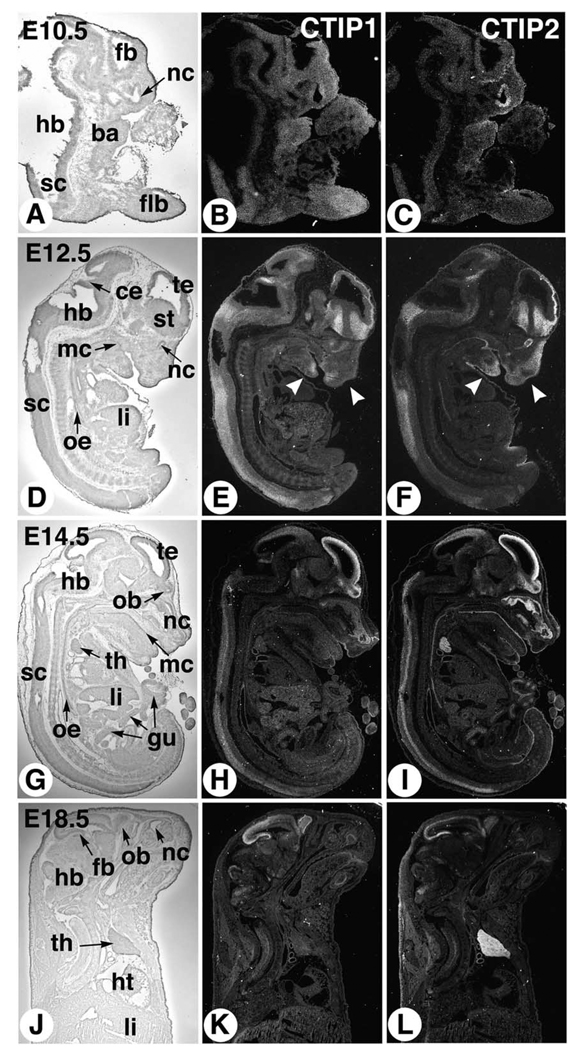
Fig. 1.
Expression of CTIP2 and CTIP2 during mouse development. Sagittal sections of mouse embryos or fetuses at 10.5 (A–C), 12.5 (D–F), 14.5 (G–I), and 18.5 d.p.c. (J–L), hybridized with antisense [35S]-labeled cRNAs corresponding to CTIP1 (middle column) and CTIP2 (right column), were examined by dark-field microscopy for signal detection (signal grain appears in white). A bright-field view of one of the corresponding sections is shown in the left column for histological orientation. ba, branchial arches; ce, cerebellum; fb, forebrain; flb, forelimb bud; gu, gut; hb, hindbrain; ht, heart; li, liver; mc, mouth cavity; nc, nasal cavity; ob, olfactory bulb; oe, esophagus; sc, spinal cord; st, striatum; te, telencephalic vesicle; th, thymus. Arrowheads in (E,F) point to differential spatial expression domains in the developing mandibular and frontonasal region.

