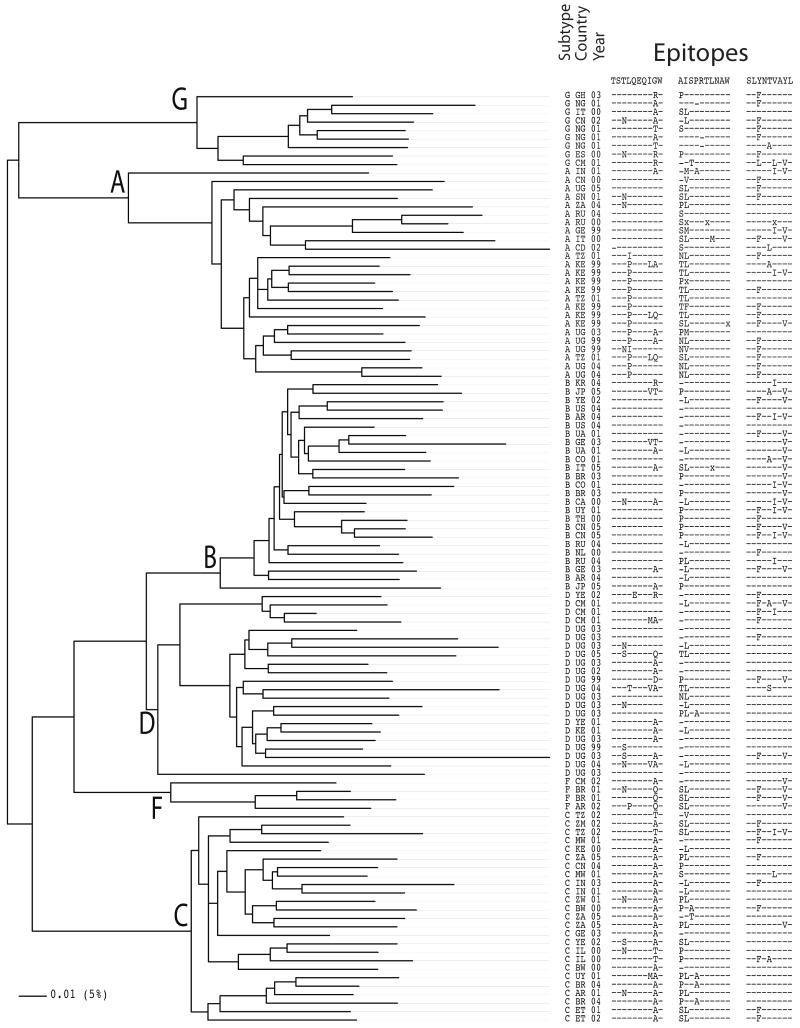
Figure 2. Global diversity.
A phylogenetic tree is shown of HIV-1 Gag from a set of isolates within the last 10 years from diverse locations throughout the world. Branch lengths reflect overall genetic distances between isolates and clades, and the epitope alignment on the right shows the impact of this diversity on three well characterized epitopes. Dashes indicated identity with the form of the epitope most often studied that is depicted at the top of each epitope alignment. The subtype, the two-letter country code indicating where the sample was obtained (www.hiv.lanl.gov/content/sequence/HelpDocs/databasecountrycode.html), and the year of isolation are indicated. The IW9 epitope also includes the preceding amino acid, as an A146P flanking substitution hinders processing and represents a common escape route (97, 98).

