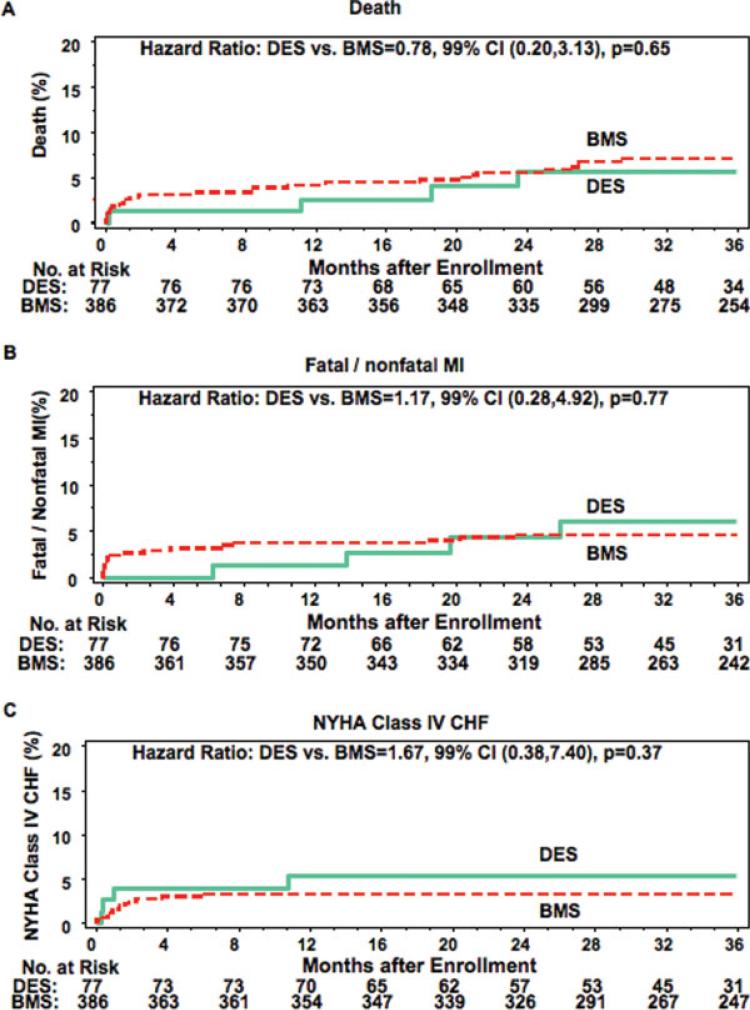
Fig. 2.
Kaplan-Meier curves for the individual secondary clinical endpoints death, reinfarction, and NYHA Class IV heart failure comparing the DES- and BMS-treated patients in the PCI arm of OAT. red = BMS, blue = DES. [Color figure can be viewed in the online issue, which is available at www.interscience.wiley.com.]

