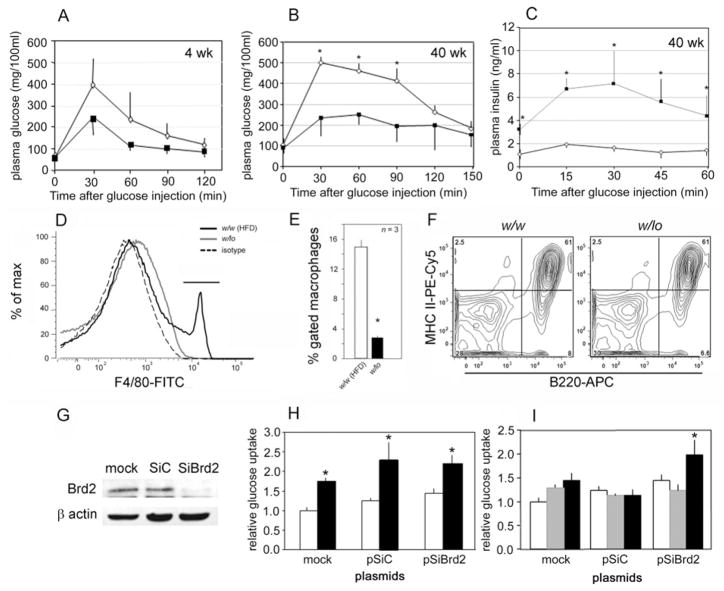
Figure 4. Reduced Brd2 enhances glucose tolerance in vivo and protects 3T3-L1 adipocytes from TNF-α-induced insulin resistance in vitro.
IGTT (1.5 g of D-glucose/kg of body weight) in w/w mice (◇) and w/lo mice (■) at 4 weeks (A) and 40 weeks (B) of age. (C) Plasma insulin production during IGTT in w/w mice (◇) and w/lo mice (■). (D) Flow cytometry of F4/80+ macrophages in the SVF isolated from the epididymal fat pad of obese w/lo mice (solid grey line) compared with obese w/w mice on a HFD [w/w (HFD)] as a positive control (solid black line) and isotype control (broken line). (E) Quantification of F4/80+ macrophages. Open bar, obese w/w mice on a HFD [w/w (HFD)]; closed bar, obese w/lo mice. (F) Normal expression of MHC class II molecules [PE (phycoerythrin)-Cy5] on the surface of antigen-presenting B-cells (B220) from the spleens of w/w mice and w/lo mice; percentages of the gated lymphocytes are shown for each quadrant of the contour plot, as described previously [57]. (G) Immunoblot for Brd2 in 3T3-L1 pre-adipocytes stably transfected with Brd2 shRNA (SiBrd2) or control (SiC) plasmids. (H) Baseline (open bars) and insulin-stimulated (closed bars) glucose uptake by 3T3-L1 adipocytes. (I) Glucose uptake of 3T3-L1 adipocytes stably transfected with Brd2 or control shRNA plasmids and treated with 4 ng/ml TNF-α for 4 days to induce insulin resistance. Open bars, baseline; grey-shaded bars, TNF-α alone; closed bars, TNF-α+insulin. n = 7 in (A), n = 4 in (B, C, H and I), and n = 3 in (E); *P<0.05.

