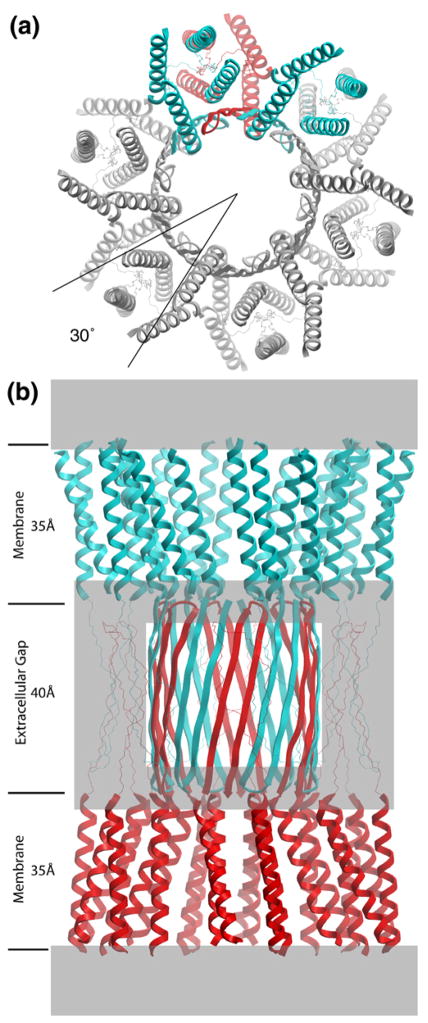
Figure 1.
Molecular design of gap junction channels. (a) Top view showing the 30° rotational stagger between docked connexons. Two subunits of the top connexon (in blue) are above one subunit of the bottom connexon (in red). The other subunits have been colored gray for clarity. The molecular boundary is depicted as a 4-helix bundle, but there are other possibilities (Figure 2). (b) Side view. The top connexon is in blue and the bottom one in red. Grayed areas denote parts of the structure that are most uncertain, especially the folding within the density at the boundary between the TM assembly and the extracellular space. Putative β sheets corresponding to E1 (on the perimeter of the extracellular gap) are drawn with thin lines to emphasize this ambiguity. The E2 loops are depicted as an interdigitating β barrel. Refer to Figures 2 and 3 in Unger et al. (1999) for the corresponding views of the 3D density map derived by electron cryo-crystallography.

