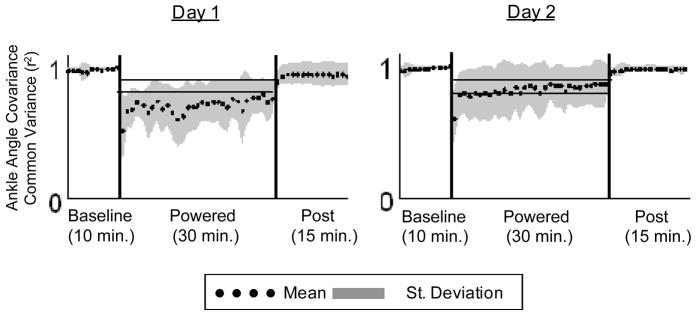
Fig. 3.
Ankle joint Pearson product moment correlation values (r2) for each minute of walking with respect to baseline. Mean (black dots) +/− SD (grey area) of all subjects (n=10). The horizontal black lines show +/− 2 standard deviations of group mean data from the last 15 min of day 2, representing steady state dynamics. These steady state envelopes are calculated from group mean data and are for display purposes only. Individual subject analyses were used for statistical tests.

