Figure 2.
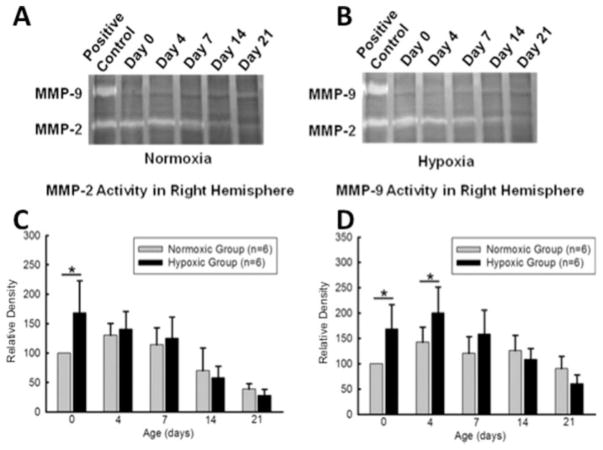
Gel zymography of right hemisphere homogenates at postnatal day 0, 4, 7, 14, and 21. Top photographs show representative zymogram gels (A, B). Bar graphs show quantified densitometry data. MMP-2 activity was increased in hypoxic animals compared to control animals at day 0 (C). MMP-9 activity was also increased in hypoxic animals at day 0 and 4 (D). No significant differences in MMP-2, MMP-9 activities were detected at other time points. *p < 0.05, N = 6 per group.

