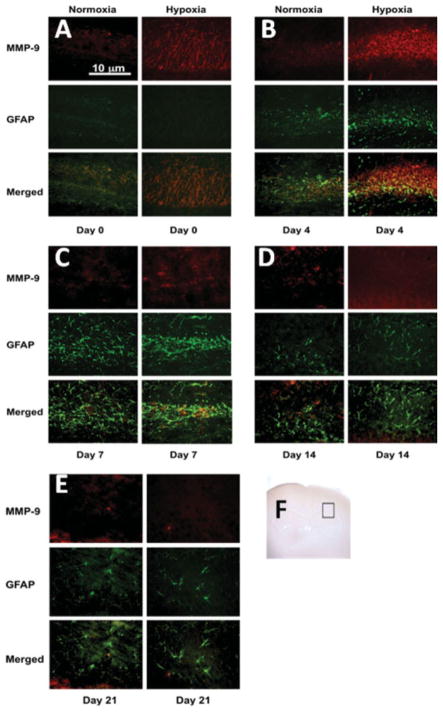
Figure 5.
Double-labeling fluorescent immunohistochemistry for MMP-9 and GFAP in hypoxic pups. Red and green stain shows MMP-9s and GFAP expression, respectively. The photographs show that the expression of MMP-9 in astrocytes in CA1 region was increased in hypoxic animals at day 0 and 4. Scale bar = 10 μm. The inserted brain slide photo (F) indicates the areas that samples were taken. [Color figure can be viewed in the online issue, which is available at www.interscience.wiley.com.]

