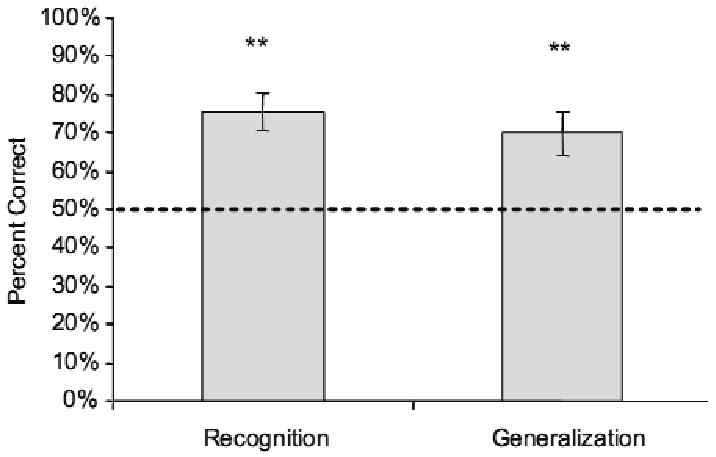
Figure 3.

Experiment 1 forced choice results plotted as percent correct in recognition and generalization trials. Average across 12 participants. For all figures, ** = p < 0.01; error bars indicate between-subject standard errors. Dashed line indicates chance levels of performance.
