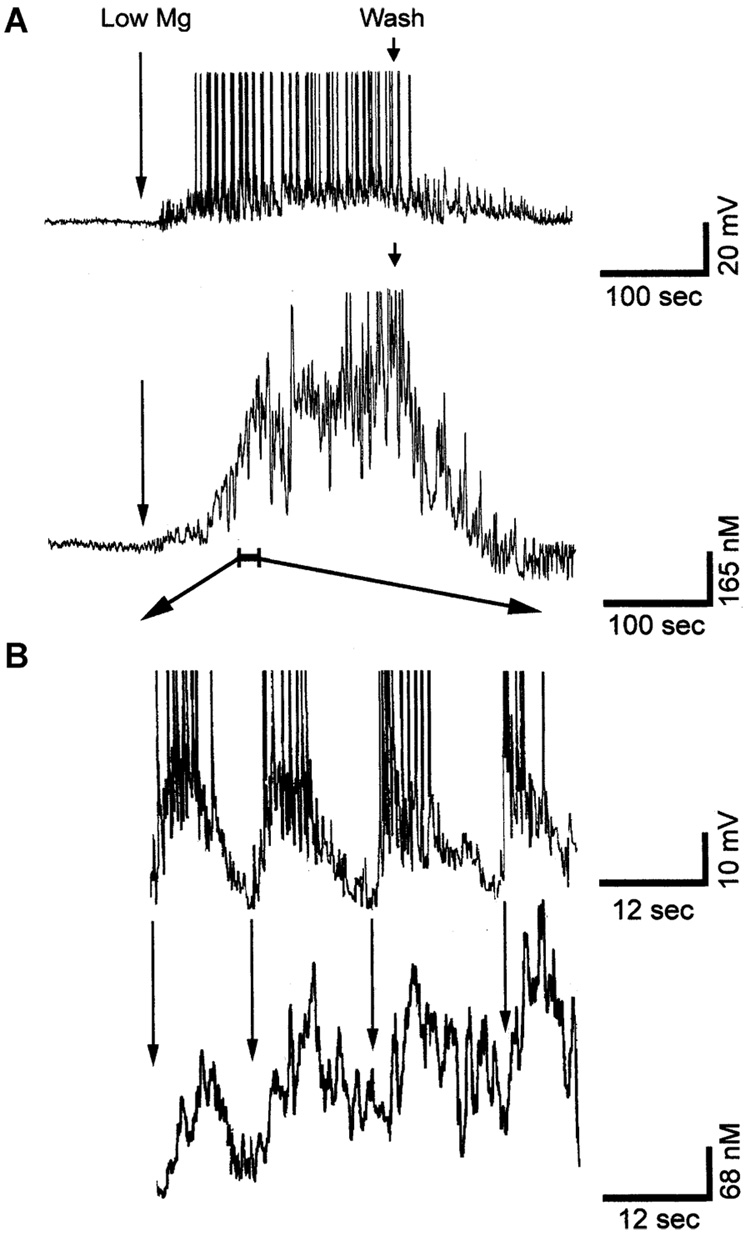
Fig. 1.
Simultaneous recording of epileptiform discharges and calcium dynamics during SE in the low-Mg2+-induced SE HNC model of AE. (A) Upper trace: a representative whole-cell current clamp recording from a neuron during SE. The neuron exhibited epileptiform-bursting activity consistent with continuous electrographic epileptiform activity. Each burst consisted of a large (30–40 mV) PDS with numerous superimposed spikes. Lower trace: simultaneous [Ca2+]i recording from the same neuron using ultra high-speed microfluorometry (5-msec resolution) demonstrating correlation between depolarization and elevations in [Ca2+]i. The [Ca2+]i level starts rising along with the subspike threshold waves of depolarization and level rises rapidly with the appearance of epileptiform bursts with numerous spikes. The comparison demonstrates that there is a direct correlation between elevated [Ca2+]i and continuous epileptiform discharges. (B) Expanded portion of a region indicated by the bar in panel A to demonstrate the relationship between each burst of action potential and the corresponding change in [Ca2+]i levels. The amplitude of spikes was truncated to emphasize the large PDS. The arrows denote the beginning of each PDS. Notice the brief time lag between the beginning of each epileptiform burst and the rise in calcium wave. Following each PDS, the [Ca2+]i could not recover to baseline levels before the next PDS occurred, and thus with each additional PDS, the [Ca2+]i gradually rose to a plateau level of ~600 nM (A). (Revised from Pal et al., 1999.)

